

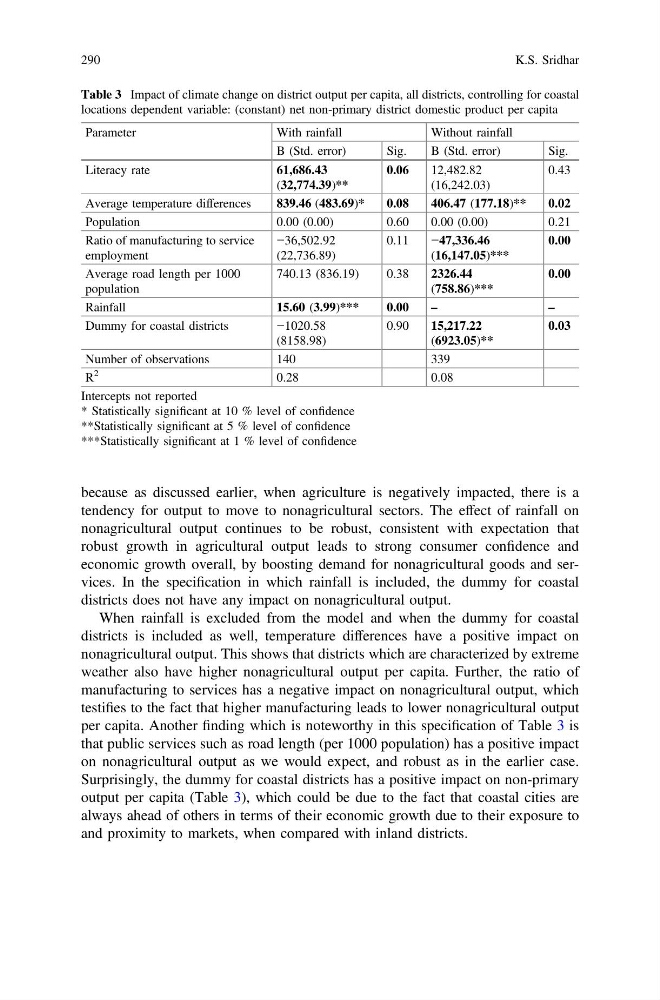
because as discussed earlier, when agriculture is negatively impacted, there is a
tendency for output to move to nonagricultural sectors. The effect of rainfall on
nonagricultural output continues to be robust, consistent with expectation that
robust growth in agricultural output leads to strong consumer confidence and
economic growth overall, by boosting demand for nonagricultural goods and services. In the specification in which rainfall is included, the dummy for coastal
districts does not have any impact on nonagricultural output.
When rainfall is excluded from the model and when the dummy for coastal
districts is included as well, temperature differences have a positive impact on
nonagricultural output. This shows that districts which are characterized by extreme
weather also have higher nonagricultural output per capita. Further, the ratio of
manufacturing to services has a negative impact on nonagricultural output, which
testifies to the fact that higher manufacturing leads to lower nonagricultural output
per capita. Another finding which is noteworthy in this specification of Table 3 is
that public services such as road length (per 1000 population) has a positive impact
on nonagricultural output as we would expect, and robust as in the earlier case.
Surprisingly, the dummy for coastal districts has a positive impact on non-primary
output per capita (Table 3), which could be due to the fact that coastal cities are
always ahead of others in terms of their economic growth due to their exposure to
and proximity to markets, when compared with inland districts.
Table 3 Impact of climate change on district output per capita, all districts, controlling for coastal
locations dependent variable: (constant) net non-primary district domestic product per capita
Parameter
With rainfall
Without rainfall
B (Std. error)
Sig.
B (Std. error)
Sig.
Literacy rate
61,686.43
(32,774.39)**
0.06
12,482.82
(16,242.03)
0.43
Average temperature differences
839.46 (483.69)*
0.08
406.47 (177.18)**
0.02
Population
0.00 (0.00)
0.60
0.00 (0.00)
0.21
Ratio of manufacturing to service
employment
−36,502.92
(22,736.89)
0.11
−47,336.46
(16,147.05)***
0.00
Average road length per 1000
population
740.13 (836.19)
0.38
2326.44
(758.86)***
0.00
Rainfall
15.60 (3.99)***
0.00
–
–
Dummy for coastal districts
−1020.58
(8158.98)
0.90
15,217.22
(6923.05)**
0.03
Number of observations
140
339
R
2
0.28
0.08
Intercepts not reported
* Statistically significant at 10 % level of confidence
**Statistically significant at 5 % level of confidence
***Statistically significant at 1 % level of confidence
290
K.S. Sridhar
tendency for output to move to nonagricultural sectors. The effect of rainfall on
nonagricultural output continues to be robust, consistent with expectation that
robust growth in agricultural output leads to strong consumer confidence and
economic growth overall, by boosting demand for nonagricultural goods and services. In the specification in which rainfall is included, the dummy for coastal
districts does not have any impact on nonagricultural output.
When rainfall is excluded from the model and when the dummy for coastal
districts is included as well, temperature differences have a positive impact on
nonagricultural output. This shows that districts which are characterized by extreme
weather also have higher nonagricultural output per capita. Further, the ratio of
manufacturing to services has a negative impact on nonagricultural output, which
testifies to the fact that higher manufacturing leads to lower nonagricultural output
per capita. Another finding which is noteworthy in this specification of Table 3 is
that public services such as road length (per 1000 population) has a positive impact
on nonagricultural output as we would expect, and robust as in the earlier case.
Surprisingly, the dummy for coastal districts has a positive impact on non-primary
output per capita (Table 3), which could be due to the fact that coastal cities are
always ahead of others in terms of their economic growth due to their exposure to
and proximity to markets, when compared with inland districts.
Table 3 Impact of climate change on district output per capita, all districts, controlling for coastal
locations dependent variable: (constant) net non-primary district domestic product per capita
Parameter
With rainfall
Without rainfall
B (Std. error)
Sig.
B (Std. error)
Sig.
Literacy rate
61,686.43
(32,774.39)**
0.06
12,482.82
(16,242.03)
0.43
Average temperature differences
839.46 (483.69)*
0.08
406.47 (177.18)**
0.02
Population
0.00 (0.00)
0.60
0.00 (0.00)
0.21
Ratio of manufacturing to service
employment
−36,502.92
(22,736.89)
0.11
−47,336.46
(16,147.05)***
0.00
Average road length per 1000
population
740.13 (836.19)
0.38
2326.44
(758.86)***
0.00
Rainfall
15.60 (3.99)***
0.00
–
–
Dummy for coastal districts
−1020.58
(8158.98)
0.90
15,217.22
(6923.05)**
0.03
Number of observations
140
339
R
2
0.28
0.08
Intercepts not reported
* Statistically significant at 10 % level of confidence
**Statistically significant at 5 % level of confidence
***Statistically significant at 1 % level of confidence
290
K.S. Sridhar