

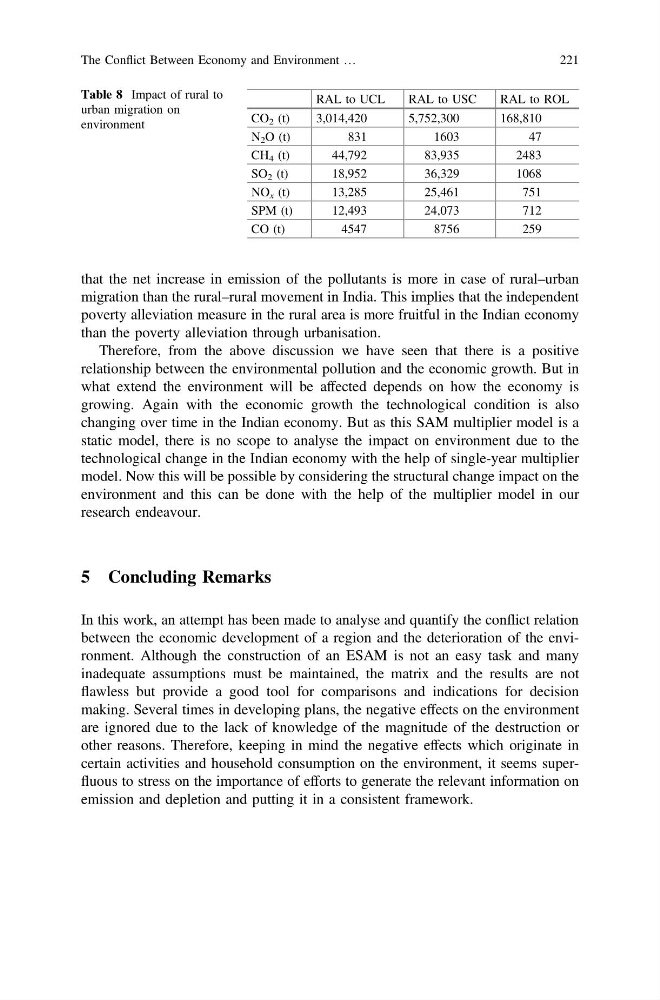
that the net increase in emission of the pollutants is more in case of rural–urban
migration than the rural–rural movement in India. This implies that the independent
poverty alleviation measure in the rural area is more fruitful in the Indian economy
than the poverty alleviation through urbanisation.
Therefore, from the above discussion we have seen that there is a positive
relationship between the environmental pollution and the economic growth. But in
what extend the environment will be affected depends on how the economy is
growing. Again with the economic growth the technological condition is also
changing over time in the Indian economy. But as this SAM multiplier model is a
static model, there is no scope to analyse the impact on environment due to the
technological change in the Indian economy with the help of single-year multiplier
model. Now this will be possible by considering the structural change impact on the
environment and this can be done with the help of the multiplier model in our
research endeavour.
5 Concluding Remarks
In this work, an attempt has been made to analyse and quantify the conflict relation
between the economic development of a region and the deterioration of the environment. Although the construction of an ESAM is not an easy task and many
inadequate assumptions must be maintained, the matrix and the results are not
flawless but provide a good tool for comparisons and indications for decision
making. Several times in developing plans, the negative effects on the environment
are ignored due to the lack of knowledge of the magnitude of the destruction or
other reasons. Therefore, keeping in mind the negative effects which originate in
certain activities and household consumption on the environment, it seems superfluous to stress on the importance of efforts to generate the relevant information on
emission and depletion and putting it in a consistent framework.
Table 8 Impact of rural to
urban migration on
environment
RAL to UCL
RAL to USC
RAL to ROL
CO 2 (t)
3,014,420
5,752,300
168,810
N 2 O (t)
831
1603
47
CH 4 (t)
44,792
83,935
2483
SO 2 (t)
18,952
36,329
1068
NO x (t)
13,285
25,461
751
SPM (t)
12,493
24,073
712
CO (t)
4547
8756
259
The Conflict Between Economy and Environment …
221
migration than the rural–rural movement in India. This implies that the independent
poverty alleviation measure in the rural area is more fruitful in the Indian economy
than the poverty alleviation through urbanisation.
Therefore, from the above discussion we have seen that there is a positive
relationship between the environmental pollution and the economic growth. But in
what extend the environment will be affected depends on how the economy is
growing. Again with the economic growth the technological condition is also
changing over time in the Indian economy. But as this SAM multiplier model is a
static model, there is no scope to analyse the impact on environment due to the
technological change in the Indian economy with the help of single-year multiplier
model. Now this will be possible by considering the structural change impact on the
environment and this can be done with the help of the multiplier model in our
research endeavour.
5 Concluding Remarks
In this work, an attempt has been made to analyse and quantify the conflict relation
between the economic development of a region and the deterioration of the environment. Although the construction of an ESAM is not an easy task and many
inadequate assumptions must be maintained, the matrix and the results are not
flawless but provide a good tool for comparisons and indications for decision
making. Several times in developing plans, the negative effects on the environment
are ignored due to the lack of knowledge of the magnitude of the destruction or
other reasons. Therefore, keeping in mind the negative effects which originate in
certain activities and household consumption on the environment, it seems superfluous to stress on the importance of efforts to generate the relevant information on
emission and depletion and putting it in a consistent framework.
Table 8 Impact of rural to
urban migration on
environment
RAL to UCL
RAL to USC
RAL to ROL
CO 2 (t)
3,014,420
5,752,300
168,810
N 2 O (t)
831
1603
47
CH 4 (t)
44,792
83,935
2483
SO 2 (t)
18,952
36,329
1068
NO x (t)
13,285
25,461
751
SPM (t)
12,493
24,073
712
CO (t)
4547
8756
259
The Conflict Between Economy and Environment …
221