

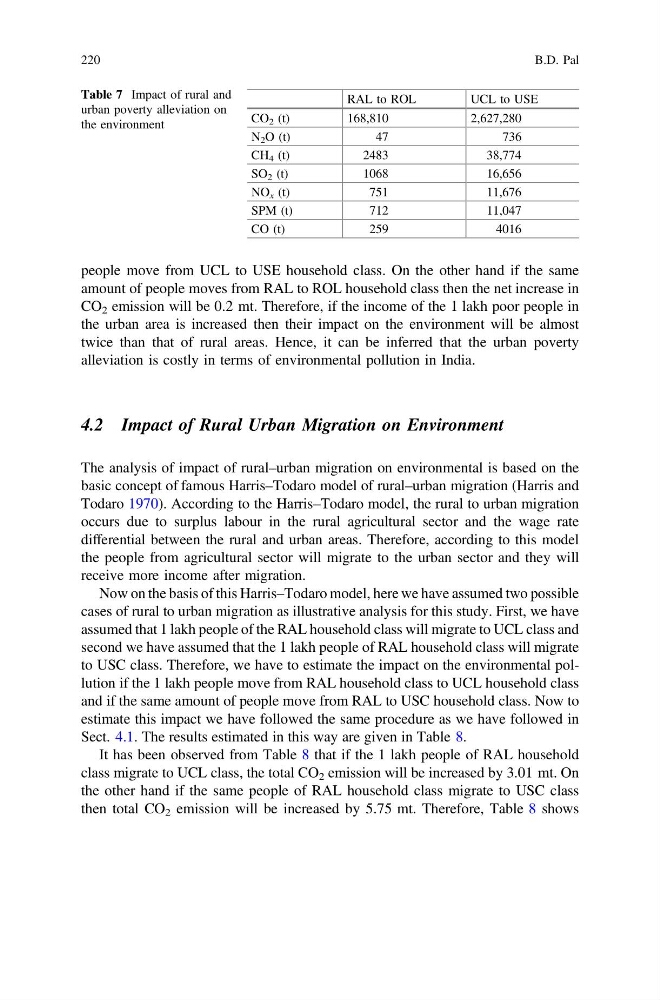
people move from UCL to USE household class. On the other hand if the same
amount of people moves from RAL to ROL household class then the net increase in
CO 2 emission will be 0.2 mt. Therefore, if the income of the 1 lakh poor people in
the urban area is increased then their impact on the environment will be almost
twice than that of rural areas. Hence, it can be inferred that the urban poverty
alleviation is costly in terms of environmental pollution in India.
4.2 Impact of Rural Urban Migration on Environment
The analysis of impact of rural–urban migration on environmental is based on the
basic concept of famous Harris–Todaro model of rural–urban migration (Harris and
Todaro 1970). According to the Harris–Todaro model, the rural to urban migration
occurs due to surplus labour in the rural agricultural sector and the wage rate
differential between the rural and urban areas. Therefore, according to this model
the people from agricultural sector will migrate to the urban sector and they will
receive more income after migration.
Now on the basis of this Harris–Todaro model, here we have assumed two possible
cases of rural to urban migration as illustrative analysis for this study. First, we have
assumed that 1 lakh people of the RAL household class will migrate to UCL class and
second we have assumed that the 1 lakh people of RAL household class will migrate
to USC class. Therefore, we have to estimate the impact on the environmental pollution if the 1 lakh people move from RAL household class to UCL household class
and if the same amount of people move from RAL to USC household class. Now to
estimate this impact we have followed the same procedure as we have followed in
Sect. 4.1. The results estimated in this way are given in Table 8.
It has been observed from Table 8 that if the 1 lakh people of RAL household
class migrate to UCL class, the total CO 2 emission will be increased by 3.01 mt. On
the other hand if the same people of RAL household class migrate to USC class
then total CO 2 emission will be increased by 5.75 mt. Therefore, Table 8 shows
Table 7 Impact of rural and
urban poverty alleviation on
the environment
RAL to ROL
UCL to USE
CO 2 (t)
168,810
2,627,280
N 2 O (t)
47
736
CH 4 (t)
2483
38,774
SO 2 (t)
1068
16,656
NO x (t)
751
11,676
SPM (t)
712
11,047
CO (t)
259
4016
220
B.D. Pal
amount of people moves from RAL to ROL household class then the net increase in
CO 2 emission will be 0.2 mt. Therefore, if the income of the 1 lakh poor people in
the urban area is increased then their impact on the environment will be almost
twice than that of rural areas. Hence, it can be inferred that the urban poverty
alleviation is costly in terms of environmental pollution in India.
4.2 Impact of Rural Urban Migration on Environment
The analysis of impact of rural–urban migration on environmental is based on the
basic concept of famous Harris–Todaro model of rural–urban migration (Harris and
Todaro 1970). According to the Harris–Todaro model, the rural to urban migration
occurs due to surplus labour in the rural agricultural sector and the wage rate
differential between the rural and urban areas. Therefore, according to this model
the people from agricultural sector will migrate to the urban sector and they will
receive more income after migration.
Now on the basis of this Harris–Todaro model, here we have assumed two possible
cases of rural to urban migration as illustrative analysis for this study. First, we have
assumed that 1 lakh people of the RAL household class will migrate to UCL class and
second we have assumed that the 1 lakh people of RAL household class will migrate
to USC class. Therefore, we have to estimate the impact on the environmental pollution if the 1 lakh people move from RAL household class to UCL household class
and if the same amount of people move from RAL to USC household class. Now to
estimate this impact we have followed the same procedure as we have followed in
Sect. 4.1. The results estimated in this way are given in Table 8.
It has been observed from Table 8 that if the 1 lakh people of RAL household
class migrate to UCL class, the total CO 2 emission will be increased by 3.01 mt. On
the other hand if the same people of RAL household class migrate to USC class
then total CO 2 emission will be increased by 5.75 mt. Therefore, Table 8 shows
Table 7 Impact of rural and
urban poverty alleviation on
the environment
RAL to ROL
UCL to USE
CO 2 (t)
168,810
2,627,280
N 2 O (t)
47
736
CH 4 (t)
2483
38,774
SO 2 (t)
1068
16,656
NO x (t)
751
11,676
SPM (t)
712
11,047
CO (t)
259
4016
220
B.D. Pal