

• Factor 1 that accounts for the largest variance (about 31 %) includes population
density, percentage of literacy rate, livestock unit/lakh population and per capita
income.
• In component 2, 20 % variation is explained by 3 variables, namely, percentage
of SC and ST population, percentage of marginal land holders and total area
under fruit crops.
• In factor 3, 16 % of variation is explained by 3 variables, namely, percentage of
non-workers, cropping intensity and percentage of irrigated area.
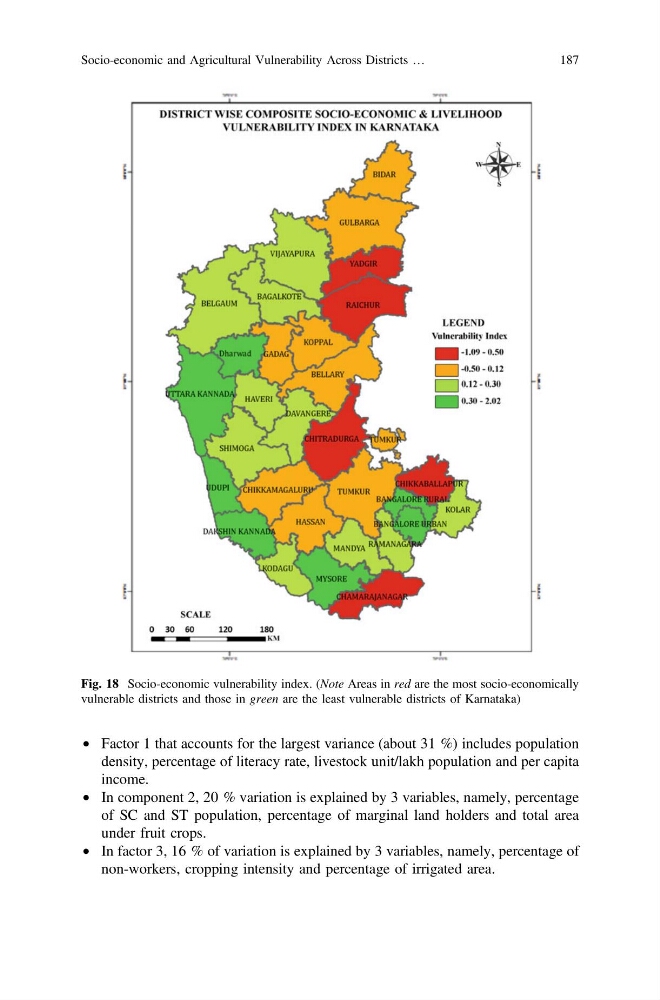
Fig. 18 Socio-economic vulnerability index. (Note Areas in red are the most socio-economically
vulnerable districts and those in green are the least vulnerable districts of Karnataka)
Socio-economic and Agricultural Vulnerability Across Districts …
187
density, percentage of literacy rate, livestock unit/lakh population and per capita
income.
• In component 2, 20 % variation is explained by 3 variables, namely, percentage
of SC and ST population, percentage of marginal land holders and total area
under fruit crops.
• In factor 3, 16 % of variation is explained by 3 variables, namely, percentage of
non-workers, cropping intensity and percentage of irrigated area.
Fig. 18 Socio-economic vulnerability index. (Note Areas in red are the most socio-economically
vulnerable districts and those in green are the least vulnerable districts of Karnataka)
Socio-economic and Agricultural Vulnerability Across Districts …
187