

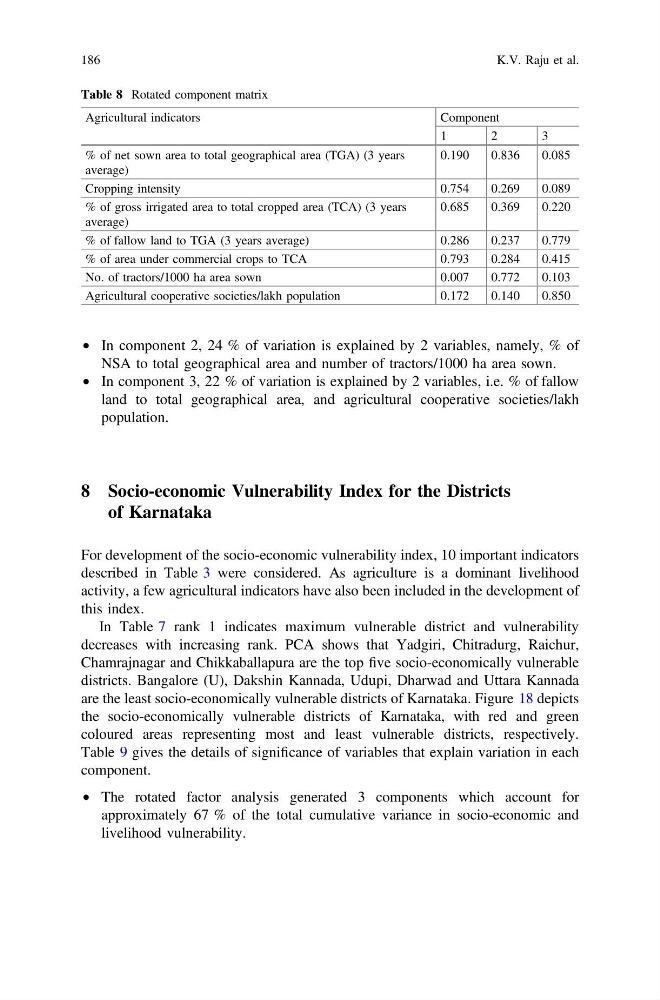
• In component 2, 24 % of variation is explained by 2 variables, namely, % of
NSA to total geographical area and number of tractors/1000 ha area sown.
• In component 3, 22 % of variation is explained by 2 variables, i.e. % of fallow
land to total geographical area, and agricultural cooperative societies/lakh
population.
8 Socio-economic Vulnerability Index for the Districts
of Karnataka
For development of the socio-economic vulnerability index, 10 important indicators
described in Table 3 were considered. As agriculture is a dominant livelihood
activity, a few agricultural indicators have also been included in the development of
this index.
In Table 7 rank 1 indicates maximum vulnerable district and vulnerability
decreases with increasing rank. PCA shows that Yadgiri, Chitradurg, Raichur,
Chamrajnagar and Chikkaballapura are the top five socio-economically vulnerable
districts. Bangalore (U), Dakshin Kannada, Udupi, Dharwad and Uttara Kannada
are the least socio-economically vulnerable districts of Karnataka. Figure 18 depicts
the socio-economically vulnerable districts of Karnataka, with red and green
coloured areas representing most and least vulnerable districts, respectively.
Table 9 gives the details of significance of variables that explain variation in each
component.
• The rotated factor analysis generated 3 components which account for
approximately 67 % of the total cumulative variance in socio-economic and
livelihood vulnerability.
Table 8 Rotated component matrix
Agricultural indicators
Component
1
2
3
% of net sown area to total geographical area (TGA) (3 years
average)
0.190
0.836
0.085
Cropping intensity
0.754
0.269
0.089
% of gross irrigated area to total cropped area (TCA) (3 years
average)
0.685
0.369
0.220
% of fallow land to TGA (3 years average)
0.286
0.237
0.779
% of area under commercial crops to TCA
0.793
0.284
0.415
No. of tractors/1000 ha area sown
0.007
0.772
0.103
Agricultural cooperative societies/lakh population
0.172
0.140
0.850
186
K.V. Raju et al.
NSA to total geographical area and number of tractors/1000 ha area sown.
• In component 3, 22 % of variation is explained by 2 variables, i.e. % of fallow
land to total geographical area, and agricultural cooperative societies/lakh
population.
8 Socio-economic Vulnerability Index for the Districts
of Karnataka
For development of the socio-economic vulnerability index, 10 important indicators
described in Table 3 were considered. As agriculture is a dominant livelihood
activity, a few agricultural indicators have also been included in the development of
this index.
In Table 7 rank 1 indicates maximum vulnerable district and vulnerability
decreases with increasing rank. PCA shows that Yadgiri, Chitradurg, Raichur,
Chamrajnagar and Chikkaballapura are the top five socio-economically vulnerable
districts. Bangalore (U), Dakshin Kannada, Udupi, Dharwad and Uttara Kannada
are the least socio-economically vulnerable districts of Karnataka. Figure 18 depicts
the socio-economically vulnerable districts of Karnataka, with red and green
coloured areas representing most and least vulnerable districts, respectively.
Table 9 gives the details of significance of variables that explain variation in each
component.
• The rotated factor analysis generated 3 components which account for
approximately 67 % of the total cumulative variance in socio-economic and
livelihood vulnerability.
Table 8 Rotated component matrix
Agricultural indicators
Component
1
2
3
% of net sown area to total geographical area (TGA) (3 years
average)
0.190
0.836
0.085
Cropping intensity
0.754
0.269
0.089
% of gross irrigated area to total cropped area (TCA) (3 years
average)
0.685
0.369
0.220
% of fallow land to TGA (3 years average)
0.286
0.237
0.779
% of area under commercial crops to TCA
0.793
0.284
0.415
No. of tractors/1000 ha area sown
0.007
0.772
0.103
Agricultural cooperative societies/lakh population
0.172
0.140
0.850
186
K.V. Raju et al.