

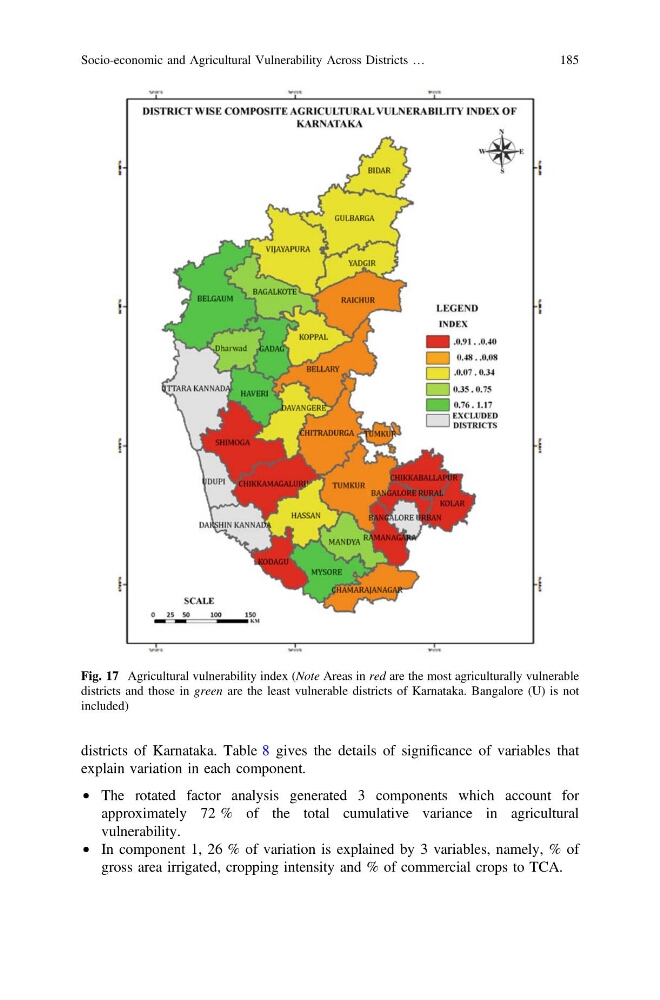
districts of Karnataka. Table 8 gives the details of significance of variables that
explain variation in each component.
• The rotated factor analysis generated 3 components which account for
approximately 72 % of the total cumulative variance in agricultural
vulnerability.
• In component 1, 26 % of variation is explained by 3 variables, namely, % of
gross area irrigated, cropping intensity and % of commercial crops to TCA.
Fig. 17 Agricultural vulnerability index (Note Areas in red are the most agriculturally vulnerable
districts and those in green are the least vulnerable districts of Karnataka. Bangalore (U) is not
included)
Socio-economic and Agricultural Vulnerability Across Districts …
185
explain variation in each component.
• The rotated factor analysis generated 3 components which account for
approximately 72 % of the total cumulative variance in agricultural
vulnerability.
• In component 1, 26 % of variation is explained by 3 variables, namely, % of
gross area irrigated, cropping intensity and % of commercial crops to TCA.
Fig. 17 Agricultural vulnerability index (Note Areas in red are the most agriculturally vulnerable
districts and those in green are the least vulnerable districts of Karnataka. Bangalore (U) is not
included)
Socio-economic and Agricultural Vulnerability Across Districts …
185