

312
A. di Sarra, M. Cacciani, 1. DeLuisi, L. De Silvestri, T. Di Iorio, G. Fiacco, P. Grigioni
presence of relatively large particles. The presence of desert dust over the
Mediterranean produces a large perturbation to the atmospheric structure, and
influences its radiative budget. Large effects on the surface ultraviolet irradiance
have also been observed (di Sarra et al., 2001 b). The development of small clouds
within the dust layer is noticeable in Fig. 1 (dark regions at about 6 km between 18
and 21 UT).
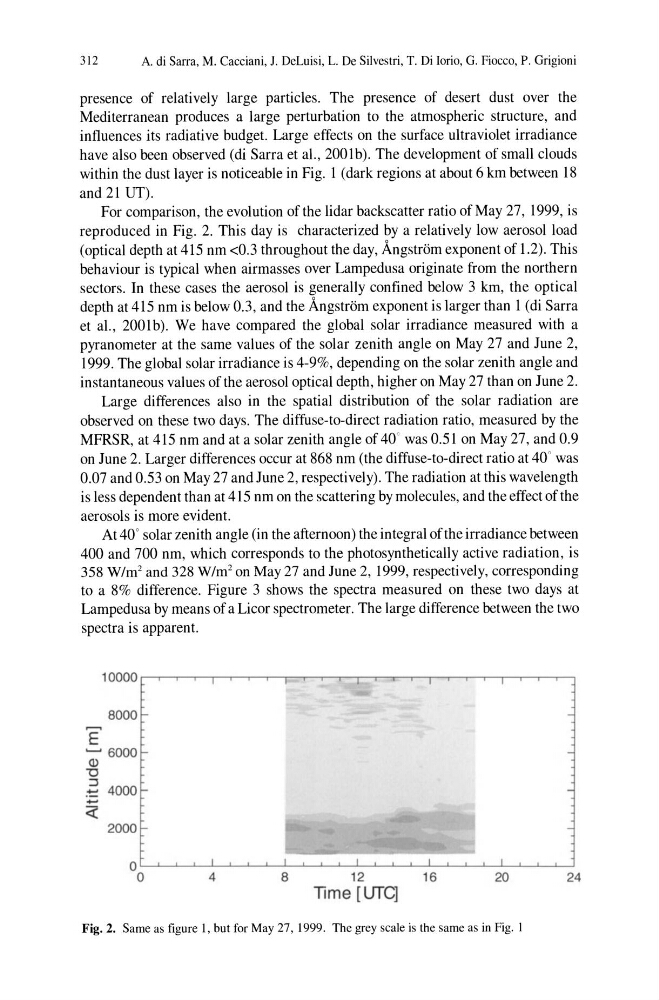
For comparison, the evolution of the lidar backscatter ratio of May 27, 1999, is
reproduced in Fig. 2. This day is characterized by a relatively low aerosol load
(optical depth at 415 nm <0.3 throughout the day, Angstrom exponent of 1.2). This
behaviour is typical when airmasses over Lampedusa originate from the northern
sectors. In these cases the aerosol is generally confined below 3 km, the optical
depth at 415 nm is below 0.3, and the Angstrom exponent is larger than 1 (di Sarra
et al., 2001b). We have compared the global solar irradiance measured with a
pyranometer at the same values of the solar zenith angle on May 27 and June 2,
1999. The global solar irradiance is 4-9%, depending on the solar zenith angle and
instantaneous values of the aerosol optical depth, higher on May 27 than on June 2.
Large differences also in the spatial distribution of the solar radiation are
observed on these two days. The diffuse-to-direct radiation ratio, measured by the
MFRSR, at 415 nm and at a solar zenith angle of 40' was 0.51 on May 27, and 0.9
on June 2. Larger differences occur at 868 nm (the diffuse-to-direct ratio at 40' was
0.07 and 0.53 on May 27 and June 2, respectively). The radiation at this wavelength
is less dependent than at 415 nm on the scattering by molecules, and the effect of the
aerosols is more evident.
At 40° solar zenith angle (in the afternoon) the integral of the irradiance between
400 and 700 nm, which corresponds to the photosynthetically active radiation, is
358 W/m2 and 328 W/m2 on May 27 and June 2, 1999, respectively, corresponding
to a 8% difference. Figure 3 shows the spectra measured on these two days at
Lampedusa by means of a Licor spectrometer. The large difference between the two
spectra is apparent.
8000
E
~ 6000
Q)
"0
.2 4000
~
2000
4
8
12
Time [UTC]
16
20
Fig. 2. Same as figure I, but for May 27,1999. The grey scale is the same as in Fig. 1
24
A. di Sarra, M. Cacciani, 1. DeLuisi, L. De Silvestri, T. Di Iorio, G. Fiacco, P. Grigioni
presence of relatively large particles. The presence of desert dust over the
Mediterranean produces a large perturbation to the atmospheric structure, and
influences its radiative budget. Large effects on the surface ultraviolet irradiance
have also been observed (di Sarra et al., 2001 b). The development of small clouds
within the dust layer is noticeable in Fig. 1 (dark regions at about 6 km between 18
and 21 UT).
For comparison, the evolution of the lidar backscatter ratio of May 27, 1999, is
reproduced in Fig. 2. This day is characterized by a relatively low aerosol load
(optical depth at 415 nm <0.3 throughout the day, Angstrom exponent of 1.2). This
behaviour is typical when airmasses over Lampedusa originate from the northern
sectors. In these cases the aerosol is generally confined below 3 km, the optical
depth at 415 nm is below 0.3, and the Angstrom exponent is larger than 1 (di Sarra
et al., 2001b). We have compared the global solar irradiance measured with a
pyranometer at the same values of the solar zenith angle on May 27 and June 2,
1999. The global solar irradiance is 4-9%, depending on the solar zenith angle and
instantaneous values of the aerosol optical depth, higher on May 27 than on June 2.
Large differences also in the spatial distribution of the solar radiation are
observed on these two days. The diffuse-to-direct radiation ratio, measured by the
MFRSR, at 415 nm and at a solar zenith angle of 40' was 0.51 on May 27, and 0.9
on June 2. Larger differences occur at 868 nm (the diffuse-to-direct ratio at 40' was
0.07 and 0.53 on May 27 and June 2, respectively). The radiation at this wavelength
is less dependent than at 415 nm on the scattering by molecules, and the effect of the
aerosols is more evident.
At 40° solar zenith angle (in the afternoon) the integral of the irradiance between
400 and 700 nm, which corresponds to the photosynthetically active radiation, is
358 W/m2 and 328 W/m2 on May 27 and June 2, 1999, respectively, corresponding
to a 8% difference. Figure 3 shows the spectra measured on these two days at
Lampedusa by means of a Licor spectrometer. The large difference between the two
spectra is apparent.
8000
E
~ 6000
Q)
"0
.2 4000
~
2000
4
8
12
Time [UTC]
16
20
Fig. 2. Same as figure I, but for May 27,1999. The grey scale is the same as in Fig. 1
24