

Desert Aerosol in the Mediterranean
311
irradiance, aerosol optical depth, greenhouse gas concentration, global solar
irradiance and meteorological parameters are routinely measured. A tropospheric
Iidar has been installed by the University of Rome, providing vertical profiles of
aerosol back scattering and depolarization (di Sarra et ai., 200 I a). Other instruments
are under development: a Raman lidar to retrieve water vapour profiles in daytime
is being developed jointly by University of Rome and ENEA; a system to launch
ozone- and radiosondes will be installed in the near future.
2 Measurements
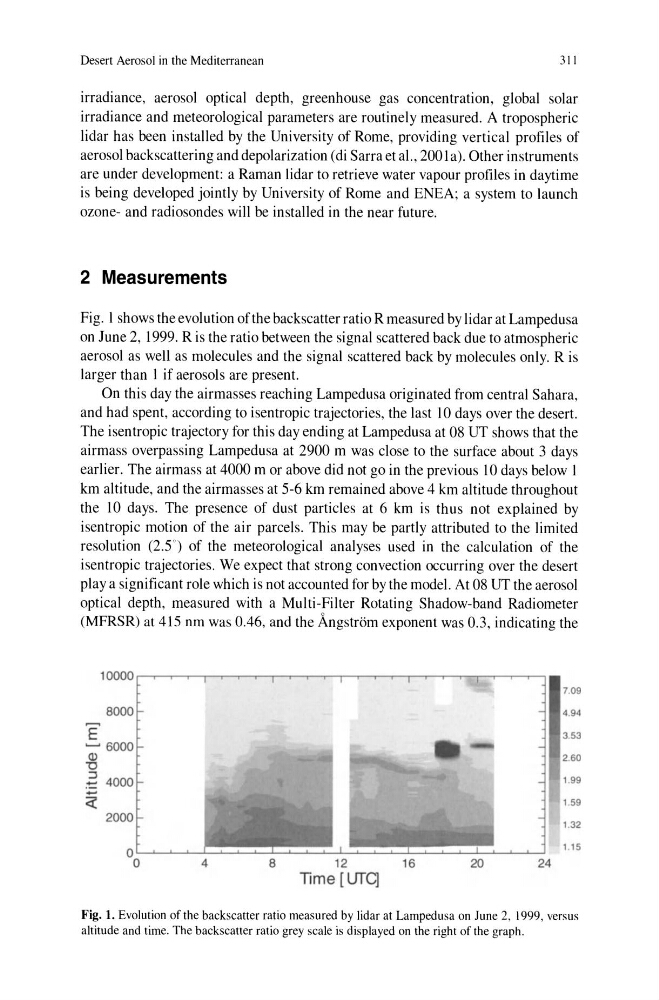
Fig. I shows the evolution of the backscatter ratio R measured by lidar at Lampedusa
on June 2, 1999. R is the ratio between the signal scattered back due to atmospheric
aerosol as well as molecules and the signal scattered back by molecules only. R is
larger than 1 if aerosols are present.
On this day the airmasses reaching Lampedusa originated from central Sahara,
and had spent, according to isentropic trajectories, the last 10 days over the desert.
The isentropic trajectory for this day ending at Lampedusa at 08 UT shows that the
airmass overpassing Lampedusa at 2900 m was close to the surface about 3 days
earlier. The airmass at 4000 m or above did not go in the previous 10 days below I
km altitude, and the airmasses at 5-6 km remained above 4 km altitude throughout
the 10 days. The presence of dust particles at 6 km is thus not explained by
isentropic motion of the air parcels. This may be partly attributed to the limited
resolution (205') of the meteorological analyses used in the calculation of the
isentropic trajectories. We expect that strong convection occurring over the desert
playa significant role which is not accounted for by the model. At 08 UT the aerosol
optical depth, measured with a Multi-Filter Rotating Shadow-band Radiometer
(MFRSR) at 415 nm was 0.46, and the Angstrom exponent was 0.3, indicating the
8000
E
~ 6000
Q)
"0
.3 4000
2000
4
8
12
16
lime [VTq
7.09
4.94
3.53
2.60
1.99
1.59
1.32
1.15
20
24
Fig. 1. Evolution of the backscatter ratio measured by lidar at Lampedusa on June 2, 1999, versus
altitude and time. The backscatter ratio grey scale is displayed on the right of the graph.
311
irradiance, aerosol optical depth, greenhouse gas concentration, global solar
irradiance and meteorological parameters are routinely measured. A tropospheric
Iidar has been installed by the University of Rome, providing vertical profiles of
aerosol back scattering and depolarization (di Sarra et ai., 200 I a). Other instruments
are under development: a Raman lidar to retrieve water vapour profiles in daytime
is being developed jointly by University of Rome and ENEA; a system to launch
ozone- and radiosondes will be installed in the near future.
2 Measurements
Fig. I shows the evolution of the backscatter ratio R measured by lidar at Lampedusa
on June 2, 1999. R is the ratio between the signal scattered back due to atmospheric
aerosol as well as molecules and the signal scattered back by molecules only. R is
larger than 1 if aerosols are present.
On this day the airmasses reaching Lampedusa originated from central Sahara,
and had spent, according to isentropic trajectories, the last 10 days over the desert.
The isentropic trajectory for this day ending at Lampedusa at 08 UT shows that the
airmass overpassing Lampedusa at 2900 m was close to the surface about 3 days
earlier. The airmass at 4000 m or above did not go in the previous 10 days below I
km altitude, and the airmasses at 5-6 km remained above 4 km altitude throughout
the 10 days. The presence of dust particles at 6 km is thus not explained by
isentropic motion of the air parcels. This may be partly attributed to the limited
resolution (205') of the meteorological analyses used in the calculation of the
isentropic trajectories. We expect that strong convection occurring over the desert
playa significant role which is not accounted for by the model. At 08 UT the aerosol
optical depth, measured with a Multi-Filter Rotating Shadow-band Radiometer
(MFRSR) at 415 nm was 0.46, and the Angstrom exponent was 0.3, indicating the
8000
E
~ 6000
Q)
"0
.3 4000
2000
4
8
12
16
lime [VTq
7.09
4.94
3.53
2.60
1.99
1.59
1.32
1.15
20
24
Fig. 1. Evolution of the backscatter ratio measured by lidar at Lampedusa on June 2, 1999, versus
altitude and time. The backscatter ratio grey scale is displayed on the right of the graph.