

186
Murat Tiirke~
soil moisture surplus (SURP) in mm. The WATBUG calculates monthly (or daily)
PE, according to the well-known Thornthwaite (1948) methodology. To calculate the
UPE, an array of monthly heat indices (H and HEAT are only calculated during
balancing), an empirical coefficient (A), and an array of UPE values are obtained.
Annual totals are calculated from each January 1 to the end of that year (December
31). When daily computations are made, PE(I) is divided by 30. Following this, PECI)
is adjusted for variable day and month lengths.
The AI values below 1.0 show an annual moisture deficit in average climatic
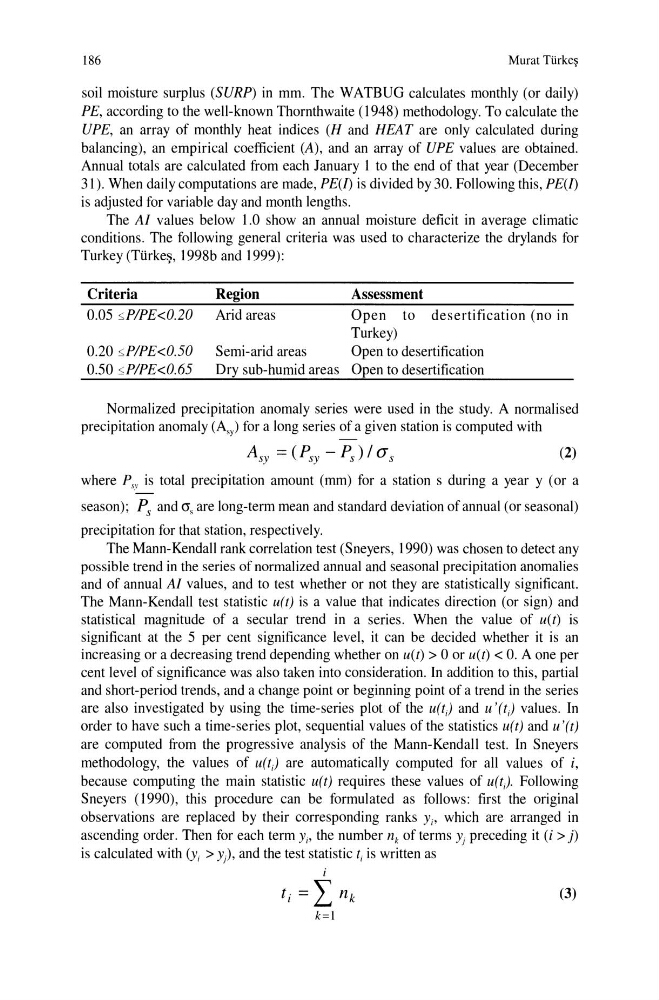
conditions. The following general criteria was used to characterize the drylands for
Turkey (Tiirke:;;, 1998b and 1999):
Criteria
0.05 sPIPE
Arid areas
Semi-arid areas
Dry sub-humid areas
Assessment
Open to desertification (no in
Turkey)
Open to desertification
Open to desertification
Normalized precipitation anomaly series were used in the study. A normalised
precipitation anomaly (Asy) for a long series of a given station is computed with
(2)
where P" is total precipitation amount (mm) for a station s during a year y (or a
season); P s and as are long-term mean and standard deviation of annual (or seasonal)
precipitation for that station, respectively.
The Mann-Kendall rank correlation test (Sneyers, 1990) was chosen to detect any
possible trend in the series of normalized annual and seasonal precipitation anomalies
and of annual AI values, and to test whether or not they are statistically significant.
The Mann-Kendall test statistic u(t) is a value that indicates direction (or sign) and
statistical magnitude of a secular trend in a series. When the value of u(t) is
significant at the 5 per cent significance level, it can be decided whether it is an
increasing or a decreasing trend depending whether on u(t) > 0 or u(t) < O. A one per
cent level of significance was also taken into consideration. In addition to this, partial
and short-period trends, and a change point or beginning point of a trend in the series
are also investigated by using the time-series plot of the u( t) and u' (t) values. In
order to have such a time-series plot, sequential values of the statistics u(t) and u'(t)
are computed from the progressive analysis of the Mann-Kendall test. In Sneyers
methodology, the values of u(t) are automatically computed for all values of i,
because computing the main statistic u(t) requires these values of u(t). Following
Sneyers (1990), this procedure can be formulated as follows: first the original
observations are replaced by their corresponding ranks Yi' which are arranged in
ascending order. Then for each term Yi' the number n k of terms Yj preceding it (i > j)
is calculated with (Yi > y), and the test statistic ti is written as
i
ti = Ink
(3)
k=!
Murat Tiirke~
soil moisture surplus (SURP) in mm. The WATBUG calculates monthly (or daily)
PE, according to the well-known Thornthwaite (1948) methodology. To calculate the
UPE, an array of monthly heat indices (H and HEAT are only calculated during
balancing), an empirical coefficient (A), and an array of UPE values are obtained.
Annual totals are calculated from each January 1 to the end of that year (December
31). When daily computations are made, PE(I) is divided by 30. Following this, PECI)
is adjusted for variable day and month lengths.
The AI values below 1.0 show an annual moisture deficit in average climatic
conditions. The following general criteria was used to characterize the drylands for
Turkey (Tiirke:;;, 1998b and 1999):
Criteria
0.05 sPIPE
Arid areas
Semi-arid areas
Dry sub-humid areas
Assessment
Open to desertification (no in
Turkey)
Open to desertification
Open to desertification
Normalized precipitation anomaly series were used in the study. A normalised
precipitation anomaly (Asy) for a long series of a given station is computed with
(2)
where P" is total precipitation amount (mm) for a station s during a year y (or a
season); P s and as are long-term mean and standard deviation of annual (or seasonal)
precipitation for that station, respectively.
The Mann-Kendall rank correlation test (Sneyers, 1990) was chosen to detect any
possible trend in the series of normalized annual and seasonal precipitation anomalies
and of annual AI values, and to test whether or not they are statistically significant.
The Mann-Kendall test statistic u(t) is a value that indicates direction (or sign) and
statistical magnitude of a secular trend in a series. When the value of u(t) is
significant at the 5 per cent significance level, it can be decided whether it is an
increasing or a decreasing trend depending whether on u(t) > 0 or u(t) < O. A one per
cent level of significance was also taken into consideration. In addition to this, partial
and short-period trends, and a change point or beginning point of a trend in the series
are also investigated by using the time-series plot of the u( t) and u' (t) values. In
order to have such a time-series plot, sequential values of the statistics u(t) and u'(t)
are computed from the progressive analysis of the Mann-Kendall test. In Sneyers
methodology, the values of u(t) are automatically computed for all values of i,
because computing the main statistic u(t) requires these values of u(t). Following
Sneyers (1990), this procedure can be formulated as follows: first the original
observations are replaced by their corresponding ranks Yi' which are arranged in
ascending order. Then for each term Yi' the number n k of terms Yj preceding it (i > j)
is calculated with (Yi > y), and the test statistic ti is written as
i
ti = Ink
(3)
k=!