

140
1. Luterbacher and E. Xoplaki
conditions over wide parts of Europe and even the Northern Hemisphere. It was also
rather wet at the end of the 18 th century and the beginning of the 19 th century.
However, from the 1810s the wi n ter preci pi tati on over the Medi terranean decreased
significantly. After this, the values increased again with a maximum in the early
1970s. The time series further shows the unprecedented trend towards winter
dryness over the last few decades of the 20 th century. Several droughts in many parts
of the Mediterranean during these periods were connected with problems related to
water supply.
The winter of 1608/1609 was the driest from 1500 to 1900 and has been chosen
for further analysis and to show its reconstruction quality (Fig. 4). During the 20 th
century, the two winters 1989 and 1992 were even drier than 1609 with a reduction
of precipitation of around 35% compared to the long-term mean (AD 1500-1995).
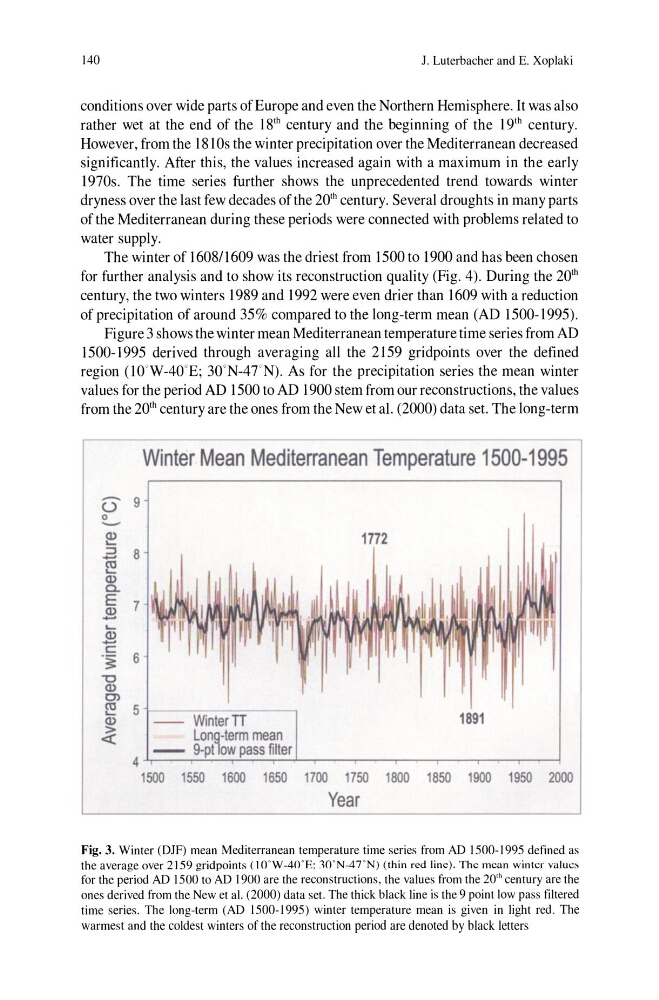
Figure 3 shows the winter mean Mediterranean temperature time series from AD
1500-1995 derived through averaging all the 2159 gridpoints over the defined
region (l0'W-40'E; 30N-4TN). As for the precipitation series the mean winter
values for the period AD 1500 to AD 1900 stem from our reconstructions, the values
from the 20 th century are the ones from the New et al. (2000) data set. The long-term
Winter Mean Mediterranean Temperature 1500-1995
- 9
U
0
---- Q)
1772
.....
::l
8
-- co
..... Q)
a.
E 7
Q)
-- .....
Q)
-- c
. ~
6
"0
Q)
0>
co 5
.....
WinterTI
1891
Q)
~
Lon~-term mean
4
g-p! ow pass filter
1500 1550 1600 1650 1700 1750 1800 1850 1900 1950 2000
Year
Fig. 3. Winter (DJF) mean Mediterranean temperature time series from AD 1500-1995 defined as
the average over 2159 gridpoints (I O"W _40oE; 30"N-4 TN) (thin red line). The mean winter values
for the period AD 1500 to AD 1900 are the reconstructions, the values from the 20 th century are the
ones derived from the New et al. (2000) data set. The thick black line is the 9 point low pass filtered
time series. The long-term (AD 1500-1995) winter temperature mean is given in light red. The
warmest and the coldest winters of the reconstruction period are denoted by black letters
1. Luterbacher and E. Xoplaki
conditions over wide parts of Europe and even the Northern Hemisphere. It was also
rather wet at the end of the 18 th century and the beginning of the 19 th century.
However, from the 1810s the wi n ter preci pi tati on over the Medi terranean decreased
significantly. After this, the values increased again with a maximum in the early
1970s. The time series further shows the unprecedented trend towards winter
dryness over the last few decades of the 20 th century. Several droughts in many parts
of the Mediterranean during these periods were connected with problems related to
water supply.
The winter of 1608/1609 was the driest from 1500 to 1900 and has been chosen
for further analysis and to show its reconstruction quality (Fig. 4). During the 20 th
century, the two winters 1989 and 1992 were even drier than 1609 with a reduction
of precipitation of around 35% compared to the long-term mean (AD 1500-1995).
Figure 3 shows the winter mean Mediterranean temperature time series from AD
1500-1995 derived through averaging all the 2159 gridpoints over the defined
region (l0'W-40'E; 30N-4TN). As for the precipitation series the mean winter
values for the period AD 1500 to AD 1900 stem from our reconstructions, the values
from the 20 th century are the ones from the New et al. (2000) data set. The long-term
Winter Mean Mediterranean Temperature 1500-1995
- 9
U
0
---- Q)
1772
.....
::l
8
-- co
..... Q)
a.
E 7
Q)
-- .....
Q)
-- c
. ~
6
"0
Q)
0>
co 5
.....
WinterTI
1891
Q)
~
Lon~-term mean
4
g-p! ow pass filter
1500 1550 1600 1650 1700 1750 1800 1850 1900 1950 2000
Year
Fig. 3. Winter (DJF) mean Mediterranean temperature time series from AD 1500-1995 defined as
the average over 2159 gridpoints (I O"W _40oE; 30"N-4 TN) (thin red line). The mean winter values
for the period AD 1500 to AD 1900 are the reconstructions, the values from the 20 th century are the
ones derived from the New et al. (2000) data set. The thick black line is the 9 point low pass filtered
time series. The long-term (AD 1500-1995) winter temperature mean is given in light red. The
warmest and the coldest winters of the reconstruction period are denoted by black letters