

500-year Winter Temperature and Precipitation Variability over the Mediterranean Area
139
3 Results
3.1
Mediterranean Winter Temperature and Precipitation Variability
AD 1500-1995
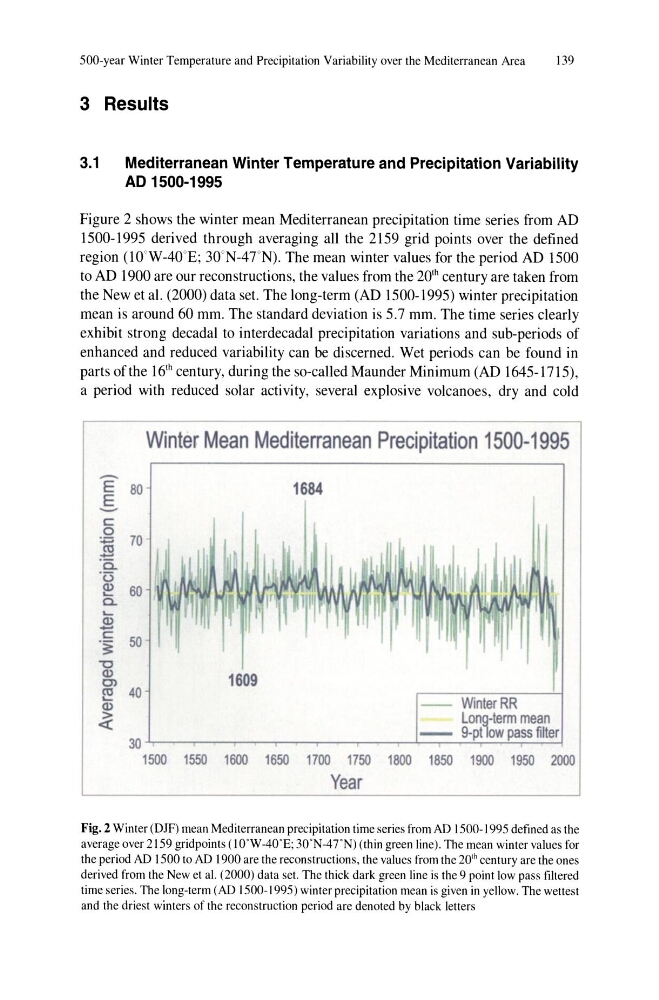
Figure 2 shows the winter mean Mediterranean precipitation time series from AD
1500-1995 derived through averaging all the 2159 grid points over the defined
region (lO' W-40cE; 30' N-4TN). The mean winter values for the period AD 1500
to AD 1900 are our reconstructions, the values from the 20 th century are taken from
the New et al. (2000) data set. The long-term (AD 1500-1995) winter precipitation
mean is around 60 mm. The standard deviation is 5.7 mm. The time series clearly
exhibit strong decadal to interdecadal precipitation variations and sub-periods of
enhanced and reduced variability can be discerned. Wet periods can be found in
parts ofthe 16 th century, during the so-called Maunder Minimum (AD 1645-1715),
a period with reduced solar activity, several explosive volcanoes, dry and cold
E 80
E
- c::::
o
:.;; 70
~
'6..
'u
~ 60
a.
La.>
.......
c::::
'3: 50
"0
Winter Mean Mediterranean Precipitation 1500-1995
1684
~
1609
~ 40
a.>
~
WinterRR
Long-term mean
9-ptlow pass filter
30 ~----------~------~----~~~~--~'---~
1500 1550 1600 1650 1700 1750 1800 1850 1900 1950 2000
Year
Fig. 2 Winter (DJF) mean Mediterranean precipitation time series from AD 1500-1995 defined as the
average over 2159 gridpoints (10"W-40"E; 30"N-4TN) (thin green line). The mean winter values for
the period AD 1500 to AD 1900 are the reconstructions, the values from the 20 th century are the ones
derived from the New et al. (2000) data set. The thick dark green line is the 9 point low pass filtered
time series. The long-term (AD 1500-1995) winter precipitation mean is given in yellow. The wettest
and the driest winters of the reconstruction period are denoted by black letters
139
3 Results
3.1
Mediterranean Winter Temperature and Precipitation Variability
AD 1500-1995
Figure 2 shows the winter mean Mediterranean precipitation time series from AD
1500-1995 derived through averaging all the 2159 grid points over the defined
region (lO' W-40cE; 30' N-4TN). The mean winter values for the period AD 1500
to AD 1900 are our reconstructions, the values from the 20 th century are taken from
the New et al. (2000) data set. The long-term (AD 1500-1995) winter precipitation
mean is around 60 mm. The standard deviation is 5.7 mm. The time series clearly
exhibit strong decadal to interdecadal precipitation variations and sub-periods of
enhanced and reduced variability can be discerned. Wet periods can be found in
parts ofthe 16 th century, during the so-called Maunder Minimum (AD 1645-1715),
a period with reduced solar activity, several explosive volcanoes, dry and cold
E 80
E
- c::::
o
:.;; 70
~
'6..
'u
~ 60
a.
La.>
.......
c::::
'3: 50
"0
Winter Mean Mediterranean Precipitation 1500-1995
1684
~
1609
~ 40
a.>
~
WinterRR
Long-term mean
9-ptlow pass filter
30 ~----------~------~----~~~~--~'---~
1500 1550 1600 1650 1700 1750 1800 1850 1900 1950 2000
Year
Fig. 2 Winter (DJF) mean Mediterranean precipitation time series from AD 1500-1995 defined as the
average over 2159 gridpoints (10"W-40"E; 30"N-4TN) (thin green line). The mean winter values for
the period AD 1500 to AD 1900 are the reconstructions, the values from the 20 th century are the ones
derived from the New et al. (2000) data set. The thick dark green line is the 9 point low pass filtered
time series. The long-term (AD 1500-1995) winter precipitation mean is given in yellow. The wettest
and the driest winters of the reconstruction period are denoted by black letters