

87
a)
b)
c)
d)
e)
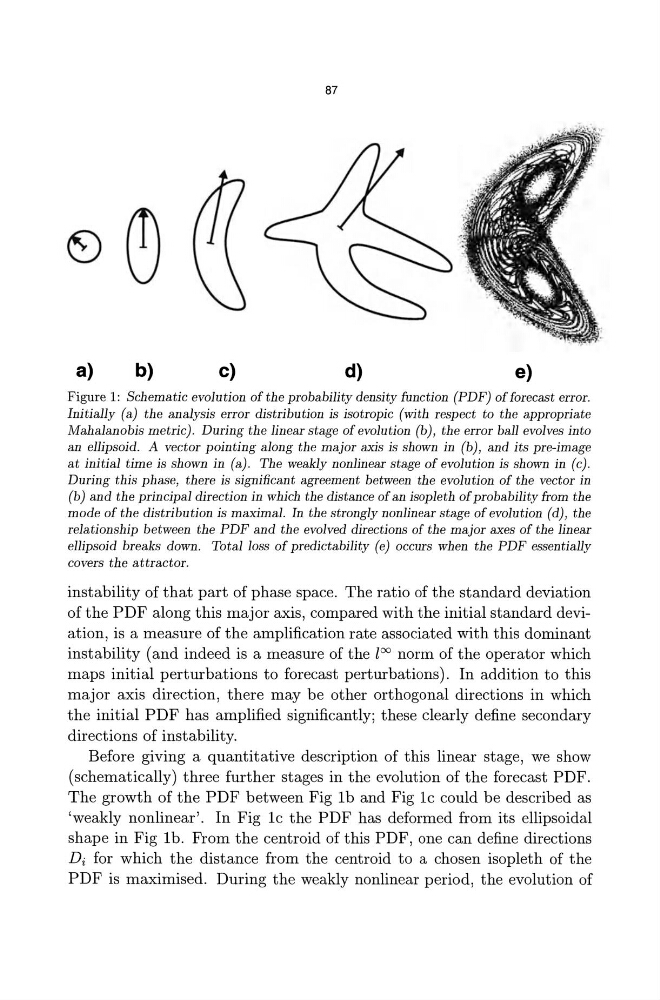
Figure 1: Schematic evolution of the probability density function (PDF) of forecast error.
Initially (a) the analysis error distribution is isotropic (with respect to the appropriate
Mahalanobis metric). During the linear stage of evolution (b), the error ball evolves into
an ellipsoid. A vector pointing along the major axis is shown in (b), and its pre-image
at initial time is shown in (a) . The weakly nonlinear stage of evolution is shown in (c) .
During this phase, there is significant agreement between the evolution of the vector in
(b) and the principal direction in which the distance of an isopleth of probability from the
mode of the distribution is maximal. In the strongly nonlinear stage of evolution (d) , the
relationship between the PDF and the evolved directions of the major axes of the linear
ellipsoid breaks down. Total loss of predictability (e) occurs when the PDF essentially
covers the attractor.
instability of that part of phase space. The ratio of the standard deviation
of the PDF along this major axis, compared with the initial standard deviation, is a measure of the amplification rate associated with this dominant
instability (and indeed is a measure of the lOO norm of the operator which
maps initial perturbations to forecast perturbations). In addition to this
major axis direction, there may be other orthogonal directions in which
the initial PDF has amplified significantly; these clearly define secondary
directions of instability.
Before giving a quantitative description of this linear stage, we show
(schematically) three further stages in the evolution of the forecast PDF.
The growth of the PDF between Fig lb and Fig Ic could be described as
'weakly nonlinear'. In Fig lc the PDF has deformed from its ellipsoidal
shape in Fig lb. From the centroid of this PDF, one can define directions
Di for which the distance from the centroid to a chosen isopleth of the
PDF is maximised. During the weakly nonlinear period, the evolution of
a)
b)
c)
d)
e)
Figure 1: Schematic evolution of the probability density function (PDF) of forecast error.
Initially (a) the analysis error distribution is isotropic (with respect to the appropriate
Mahalanobis metric). During the linear stage of evolution (b), the error ball evolves into
an ellipsoid. A vector pointing along the major axis is shown in (b), and its pre-image
at initial time is shown in (a) . The weakly nonlinear stage of evolution is shown in (c) .
During this phase, there is significant agreement between the evolution of the vector in
(b) and the principal direction in which the distance of an isopleth of probability from the
mode of the distribution is maximal. In the strongly nonlinear stage of evolution (d) , the
relationship between the PDF and the evolved directions of the major axes of the linear
ellipsoid breaks down. Total loss of predictability (e) occurs when the PDF essentially
covers the attractor.
instability of that part of phase space. The ratio of the standard deviation
of the PDF along this major axis, compared with the initial standard deviation, is a measure of the amplification rate associated with this dominant
instability (and indeed is a measure of the lOO norm of the operator which
maps initial perturbations to forecast perturbations). In addition to this
major axis direction, there may be other orthogonal directions in which
the initial PDF has amplified significantly; these clearly define secondary
directions of instability.
Before giving a quantitative description of this linear stage, we show
(schematically) three further stages in the evolution of the forecast PDF.
The growth of the PDF between Fig lb and Fig Ic could be described as
'weakly nonlinear'. In Fig lc the PDF has deformed from its ellipsoidal
shape in Fig lb. From the centroid of this PDF, one can define directions
Di for which the distance from the centroid to a chosen isopleth of the
PDF is maximised. During the weakly nonlinear period, the evolution of