

43
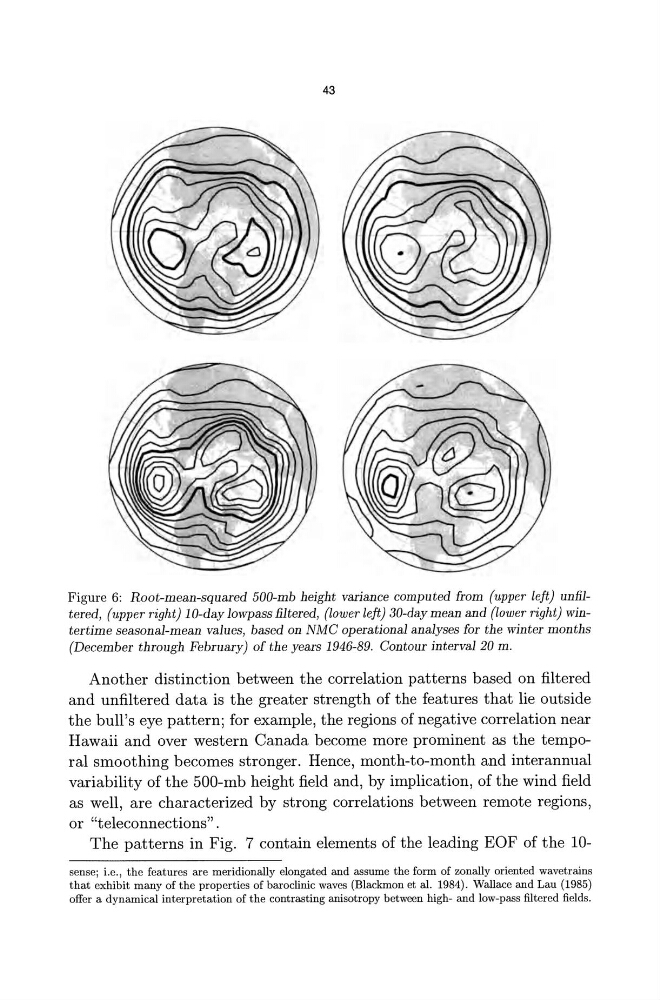
Figure 6: Root-mean-squared 500-mb height variance computed from (upper left) unfiltered, (upper right) 1 D-day lowpass filtered , (lower left) 3D-day mean and (lower right) wintertime seasonal-mean values, based on NMC operational analyses for the winter months
(December through February) of the years 1946-89. Contour interval 20 m.
Another distinction between the correlation patterns based on filtered
and unfiltered data is the greater strength of the features that lie outside
the bull's eye pattern; for example, the regions of negative correlation near
Hawaii and over western Canada become more prominent as the temporal smoothing becomes stronger. Hence, month-to-month and interannual
variability of the 500-mb height field and, by implication, of the wind field
as well, are characterized by strong correlations between remote regions,
or "teleconnections".
The patterns in Fig. 7 contain elements of the leading EOF of the 10sense; i.e., the features are meridionally elongated and assume the form of zonally oriented wavetrains
that exhibit many of the properties of baroclinic waves (Blackmon et al. 1984). Wallace and Lau (1985)
offer a dynamical interpretation of the contrasting anisotropy between high- and low-pass filtered fields.
Figure 6: Root-mean-squared 500-mb height variance computed from (upper left) unfiltered, (upper right) 1 D-day lowpass filtered , (lower left) 3D-day mean and (lower right) wintertime seasonal-mean values, based on NMC operational analyses for the winter months
(December through February) of the years 1946-89. Contour interval 20 m.
Another distinction between the correlation patterns based on filtered
and unfiltered data is the greater strength of the features that lie outside
the bull's eye pattern; for example, the regions of negative correlation near
Hawaii and over western Canada become more prominent as the temporal smoothing becomes stronger. Hence, month-to-month and interannual
variability of the 500-mb height field and, by implication, of the wind field
as well, are characterized by strong correlations between remote regions,
or "teleconnections".
The patterns in Fig. 7 contain elements of the leading EOF of the 10sense; i.e., the features are meridionally elongated and assume the form of zonally oriented wavetrains
that exhibit many of the properties of baroclinic waves (Blackmon et al. 1984). Wallace and Lau (1985)
offer a dynamical interpretation of the contrasting anisotropy between high- and low-pass filtered fields.