

42
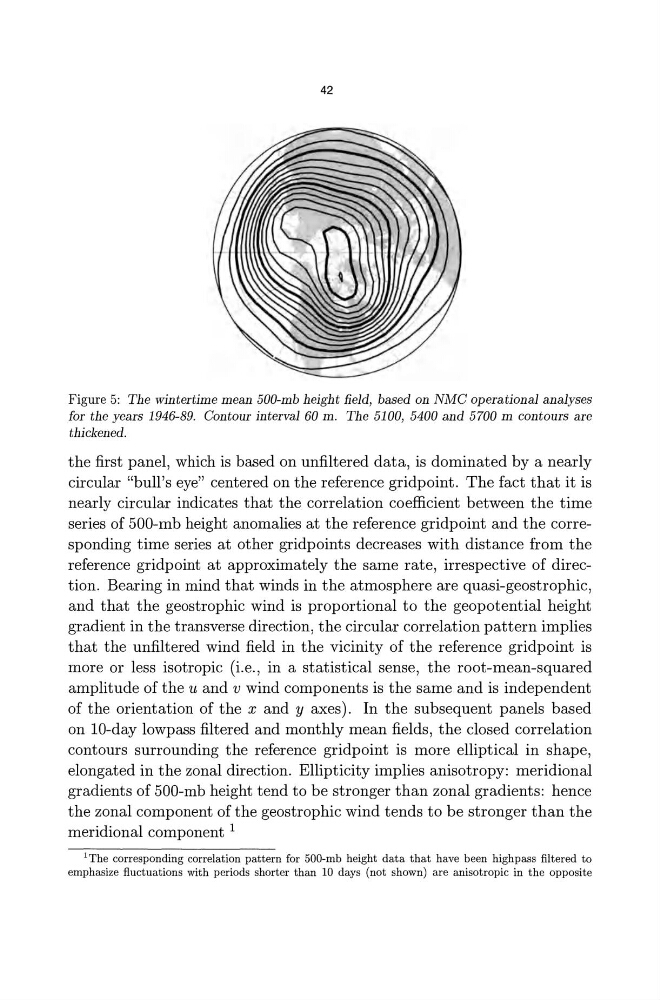
Figure 5: The wintertime mean 500-mb height field, based on NMC operational analyses
for the years 1946-89. Contour interval 60 m. The 5100, 5400 and 5700 m contours are
thickened.
the first panel, which is based on unfiltered data, is dominated by a nearly
circular "bull's eye" centered on the reference gridpoint. The fact that it is
nearly circular indicates that the correlation coefficient between the time
series of 500-mb height anomalies at the reference gridpoint and the corresponding time series at other gridpoints decreases with distance from the
reference gridpoint at approximately the same rate, irrespective of direction. Bearing in mind that winds in the atmosphere are quasi-geostrophic,
and that the geostrophic wind is proportional to the geopotential height
gradient in the transverse direction, the circular correlation pattern implies
that the unfiltered wind field in the vicinity of the reference gridpoint is
more or less isotropic (i.e., in a statistical sense, the root-mean-squared
amplitude of the u and v wind components is the same and is independent
of the orientation of the x and y axes). In the subsequent panels based
on lO-day lowpass filtered and monthly mean fields, the closed correlation
contours surrounding the reference gridpoint is more elliptical in shape,
elongated in the zonal direction. Ellipticity implies anisotropy: meridional
gradients of 500-mb height tend to be stronger than zonal gradients: hence
the zonal component of the geostrophic wind tends to be stronger than the
meridional component 1
IThe corresponding correlation pattern for 500-mb height data that have been highpass filtered to
emphasize fluctuations with periods shorter than 10 days (not shown) are anisotropic in the opposite
Figure 5: The wintertime mean 500-mb height field, based on NMC operational analyses
for the years 1946-89. Contour interval 60 m. The 5100, 5400 and 5700 m contours are
thickened.
the first panel, which is based on unfiltered data, is dominated by a nearly
circular "bull's eye" centered on the reference gridpoint. The fact that it is
nearly circular indicates that the correlation coefficient between the time
series of 500-mb height anomalies at the reference gridpoint and the corresponding time series at other gridpoints decreases with distance from the
reference gridpoint at approximately the same rate, irrespective of direction. Bearing in mind that winds in the atmosphere are quasi-geostrophic,
and that the geostrophic wind is proportional to the geopotential height
gradient in the transverse direction, the circular correlation pattern implies
that the unfiltered wind field in the vicinity of the reference gridpoint is
more or less isotropic (i.e., in a statistical sense, the root-mean-squared
amplitude of the u and v wind components is the same and is independent
of the orientation of the x and y axes). In the subsequent panels based
on lO-day lowpass filtered and monthly mean fields, the closed correlation
contours surrounding the reference gridpoint is more elliptical in shape,
elongated in the zonal direction. Ellipticity implies anisotropy: meridional
gradients of 500-mb height tend to be stronger than zonal gradients: hence
the zonal component of the geostrophic wind tends to be stronger than the
meridional component 1
IThe corresponding correlation pattern for 500-mb height data that have been highpass filtered to
emphasize fluctuations with periods shorter than 10 days (not shown) are anisotropic in the opposite