

396
10 8
-_ ............ , , ,
\
,
\
\
'N'
\
::c
10 7
"' .......
\ . /
t:
!;
en
z: UJ
10 6
Q
-'
"" a:;
fa
Db ••
"IT
en
g 10 5
10 4
50yrs
20yrs
IOyrs
PERIOD
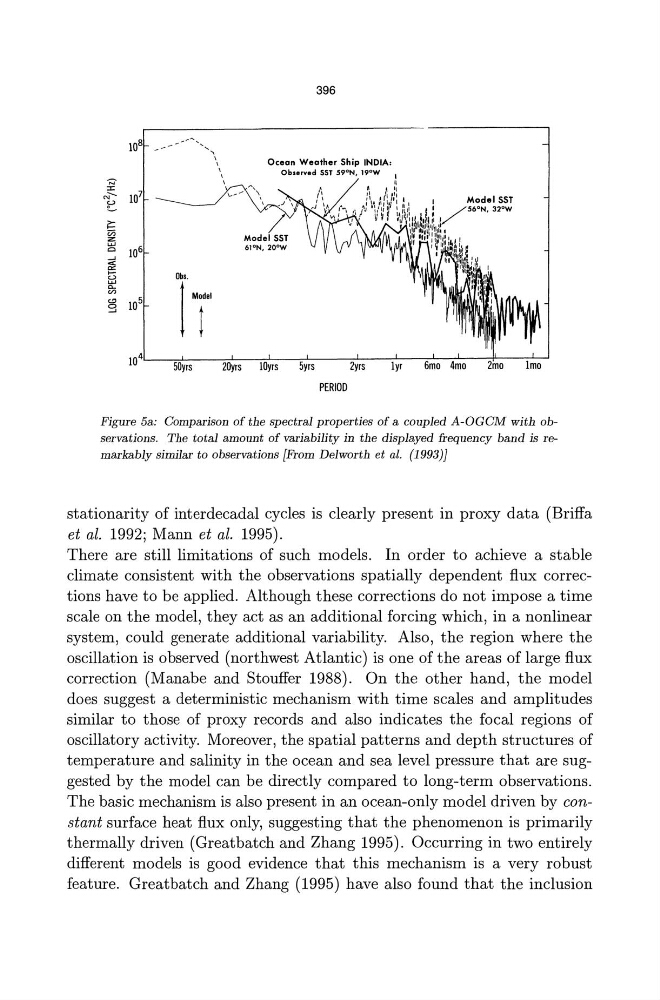
Figure 5a: Comparison of the spectral properties of a coupled A-OGCM with observations. The total amount of variability in the displayed frequency band is remarkably similar to observations {From Delworth et al. (1993)]
stationarity of interdecadal cycles is clearly present in proxy data (Briffa
et al. 1992; Mann et al. 1995).
There are still limitations of such models. In order to achieve a stable
climate consistent with the observations spatially dependent flux corrections have to be applied. Although these corrections do not impose a time
scale on the model, they act as an additional forcing which, in a nonlinear
system, could generate additional variability. Also, the region where the
oscillation is observed (northwest Atlantic) is one of the areas oflarge flux
correction (Manabe and Stouffer 1988). On the other hand, the model
does suggest a deterministic mechanism with time scales and amplitudes
similar to those of proxy records and also indicates the focal regions of
oscillatory activity. Moreover, the spatial patterns and depth structures of
temperature and salinity in the ocean and sea level pressure that are suggested by the model can be directly compared to long-term observations.
The basic mechanism is also present in an ocean-only model driven by constant surface heat flux only, suggesting that the phenomenon is primarily
thermally driven (Greatbatch and Zhang 1995). Occurring in two entirely
different models is good evidence that this mechanism is a very robust
feature. Greatbatch and Zhang (1995) have also found that the inclusion
10 8
-_ ............ , , ,
\
,
\
\
'N'
\
::c
10 7
"' .......
\ . /
t:
!;
en
z: UJ
10 6
Q
-'
"" a:;
fa
Db ••
"IT
en
g 10 5
10 4
50yrs
20yrs
IOyrs
PERIOD
Figure 5a: Comparison of the spectral properties of a coupled A-OGCM with observations. The total amount of variability in the displayed frequency band is remarkably similar to observations {From Delworth et al. (1993)]
stationarity of interdecadal cycles is clearly present in proxy data (Briffa
et al. 1992; Mann et al. 1995).
There are still limitations of such models. In order to achieve a stable
climate consistent with the observations spatially dependent flux corrections have to be applied. Although these corrections do not impose a time
scale on the model, they act as an additional forcing which, in a nonlinear
system, could generate additional variability. Also, the region where the
oscillation is observed (northwest Atlantic) is one of the areas oflarge flux
correction (Manabe and Stouffer 1988). On the other hand, the model
does suggest a deterministic mechanism with time scales and amplitudes
similar to those of proxy records and also indicates the focal regions of
oscillatory activity. Moreover, the spatial patterns and depth structures of
temperature and salinity in the ocean and sea level pressure that are suggested by the model can be directly compared to long-term observations.
The basic mechanism is also present in an ocean-only model driven by constant surface heat flux only, suggesting that the phenomenon is primarily
thermally driven (Greatbatch and Zhang 1995). Occurring in two entirely
different models is good evidence that this mechanism is a very robust
feature. Greatbatch and Zhang (1995) have also found that the inclusion