

387
$O"W
fY
longi tude
longitude
lOW
longitude
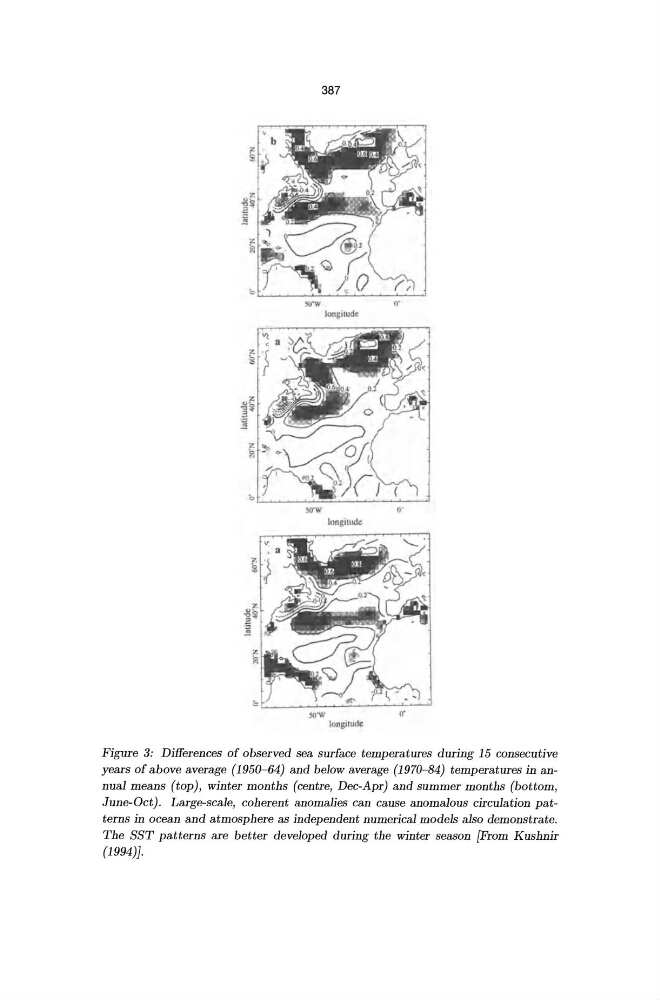
Figure 3: Differences of observed sea surface temperatures during 15 consecutive
years of above average (1950- 64) and below average (1970- 84) temperatures in annual means (top), winter months (centre, Dec-Apr) and summer months (bottom ,
June-Oct). Large-scale, coherent anomalies can cause anomalous circulation patterns in ocean and atmosphere as independent numerical models also demonstrate.
The SST patterns are better developed during the winter season [From Kushnir
(1994)}.
$O"W
fY
longi tude
longitude
lOW
longitude
Figure 3: Differences of observed sea surface temperatures during 15 consecutive
years of above average (1950- 64) and below average (1970- 84) temperatures in annual means (top), winter months (centre, Dec-Apr) and summer months (bottom ,
June-Oct). Large-scale, coherent anomalies can cause anomalous circulation patterns in ocean and atmosphere as independent numerical models also demonstrate.
The SST patterns are better developed during the winter season [From Kushnir
(1994)}.