

345
6~--70-------'------~--~'--r----'
5
4
10 3 uT
3
2
1
i
• • • • • • i'e • • • • • •
i
B
i
•
•
•
•
•
•
•
•
•
•
•
•
·-8=0
· .
·-T=O
:---f3S = aT
:---f3S = 1/2aT
· {f3 S = aTE
.... T
·
= TE
: ... S=Scrit
O~--~---.------~----~~~----~
o
2
4
6
8
10 3 (3 S
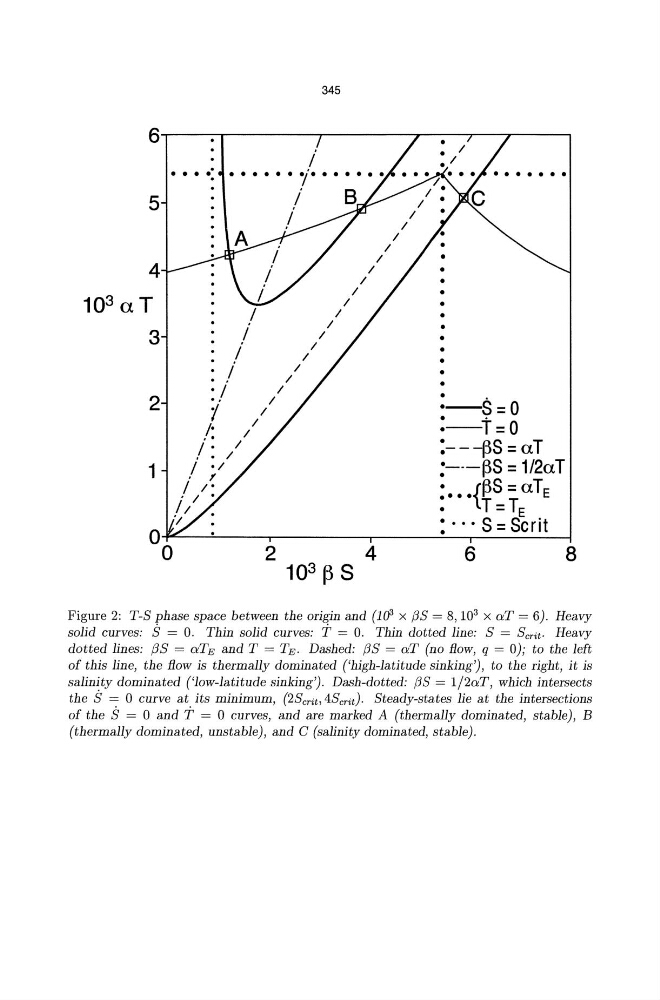
Figure 2: T-S phase space between the origin and (1cf3 x flS = 8,10 3 x aT = 6). Heavy
solid curves: S = O. Thin solid curves: T = O. Thin dotted line: S = SeTit. Heavy
dotted lines: flS = aTE and T = TE. Dashed: flS = aT (no flow, q = 0); to the left
of this line, the flow is thermally dominated ('high-latitude sinking'), to the right, it is
salinity dominated ('low-latitude sinking'). Dash-dotted: flS = 1/2aT, which intersects
the S = 0 curve at its minimum, (2SeTit,4SeTit). Steady-states lie at the intersections
of the S = 0 and T = 0 curves, and are marked A (thermally dominated, stable), B
(thermally dominated, unstable), and C (salinity dominated, stable).
6~--70-------'------~--~'--r----'
5
4
10 3 uT
3
2
1
i
• • • • • • i'e • • • • • •
i
B
i
•
•
•
•
•
•
•
•
•
•
•
•
·-8=0
· .
·-T=O
:---f3S = aT
:---f3S = 1/2aT
· {f3 S = aTE
.... T
·
= TE
: ... S=Scrit
O~--~---.------~----~~~----~
o
2
4
6
8
10 3 (3 S
Figure 2: T-S phase space between the origin and (1cf3 x flS = 8,10 3 x aT = 6). Heavy
solid curves: S = O. Thin solid curves: T = O. Thin dotted line: S = SeTit. Heavy
dotted lines: flS = aTE and T = TE. Dashed: flS = aT (no flow, q = 0); to the left
of this line, the flow is thermally dominated ('high-latitude sinking'), to the right, it is
salinity dominated ('low-latitude sinking'). Dash-dotted: flS = 1/2aT, which intersects
the S = 0 curve at its minimum, (2SeTit,4SeTit). Steady-states lie at the intersections
of the S = 0 and T = 0 curves, and are marked A (thermally dominated, stable), B
(thermally dominated, unstable), and C (salinity dominated, stable).