

300
Present
Atmopherlc
Present
Increased
Most important
Chemical
terrestrial
Trace gases
symbol
concentration residence
annual
radiation
anthropogenic
(1992)
time (year)
trends
(1750 -1990)
sources
Carbon dioxide
CO2
355 ppm
50-200
0.4%
1.56Wm·2
Fossil fuels,
deforestation land
use and land erosion
Methane
CH4
1.71 ppm
12-17
0.8%
0.47Wm·2
Rice paddles, fossil
fuels, biomass
burning, gas leaks
Nitrous oxide
N20
0.31 ppm
120
0.25%
0.14 W m·2
Fertilizer, fossil fuels,
biomass burning
Chlorofluorcarbons
CCI3F
-800 ppt
10 - 50000
2%0.28Wm-2
Refrigerants solvents
(CFCs)
CCI2F2
7%
(aerosol propellants)
etc.
Other greenhouse
0.25 W m-2
gases
Total
2.75Wm-2
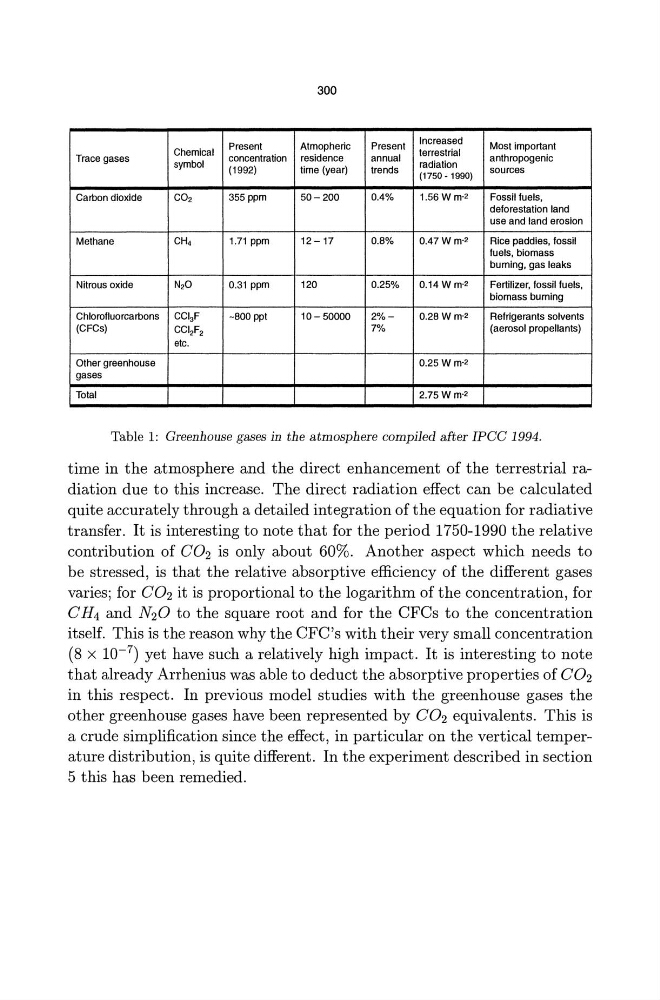
Table 1: Greenhouse gases in the atmosphere compiled after IPCC 1994.
time in the atmosphere and the direct enhancement of the terrestrial radiation due to this increase_ The direct radiation effect can be calculated
quite accurately through a detailed integration of the equation for radiative
transfer. It is interesting to note that for the period 1750-1990 the relative
contribution of CO2 is only about 60%_ Another aspect which needs to
be stressed, is that the relative absorptive efficiency of the different gases
varies; for CO2 it is proportional to the logarithm of the concentration, for
C H4 and N 20 to the square root and for the CFCs to the concentration
itself. This is the reason why the CFC's with their very small concentration
(8 x 10- 7 ) yet have such a relatively high impact_ It is interesting to note
that already Arrhenius was able to deduct the absorptive properties of CO2
in this respect. In previous model studies with the greenhouse gases the
other greenhouse gases have been represented by CO2 equivalents. This is
a crude simplification since the effect, in particular on the vertical temperature distribution, is quite different. In the experiment described in section
5 this has been remedied.
Present
Atmopherlc
Present
Increased
Most important
Chemical
terrestrial
Trace gases
symbol
concentration residence
annual
radiation
anthropogenic
(1992)
time (year)
trends
(1750 -1990)
sources
Carbon dioxide
CO2
355 ppm
50-200
0.4%
1.56Wm·2
Fossil fuels,
deforestation land
use and land erosion
Methane
CH4
1.71 ppm
12-17
0.8%
0.47Wm·2
Rice paddles, fossil
fuels, biomass
burning, gas leaks
Nitrous oxide
N20
0.31 ppm
120
0.25%
0.14 W m·2
Fertilizer, fossil fuels,
biomass burning
Chlorofluorcarbons
CCI3F
-800 ppt
10 - 50000
2%0.28Wm-2
Refrigerants solvents
(CFCs)
CCI2F2
7%
(aerosol propellants)
etc.
Other greenhouse
0.25 W m-2
gases
Total
2.75Wm-2
Table 1: Greenhouse gases in the atmosphere compiled after IPCC 1994.
time in the atmosphere and the direct enhancement of the terrestrial radiation due to this increase_ The direct radiation effect can be calculated
quite accurately through a detailed integration of the equation for radiative
transfer. It is interesting to note that for the period 1750-1990 the relative
contribution of CO2 is only about 60%_ Another aspect which needs to
be stressed, is that the relative absorptive efficiency of the different gases
varies; for CO2 it is proportional to the logarithm of the concentration, for
C H4 and N 20 to the square root and for the CFCs to the concentration
itself. This is the reason why the CFC's with their very small concentration
(8 x 10- 7 ) yet have such a relatively high impact_ It is interesting to note
that already Arrhenius was able to deduct the absorptive properties of CO2
in this respect. In previous model studies with the greenhouse gases the
other greenhouse gases have been represented by CO2 equivalents. This is
a crude simplification since the effect, in particular on the vertical temperature distribution, is quite different. In the experiment described in section
5 this has been remedied.