

298
0.8
0.8
0.7
0.7
0.6
0.6
0.5
0.5
0.4
0.4
0.3
0.3
0.2
0.2
0.1
0.1
0.0
0.0
-0.1
-0.1
-0.2
-0.2
-0.3
-0.3
- 0.4 +---,--,---.--,...-----,----.--,-----,,-----.---.--,----,---.--+- 0.4
1860
1880
1900
1920
1940
1960 .
1980
2000
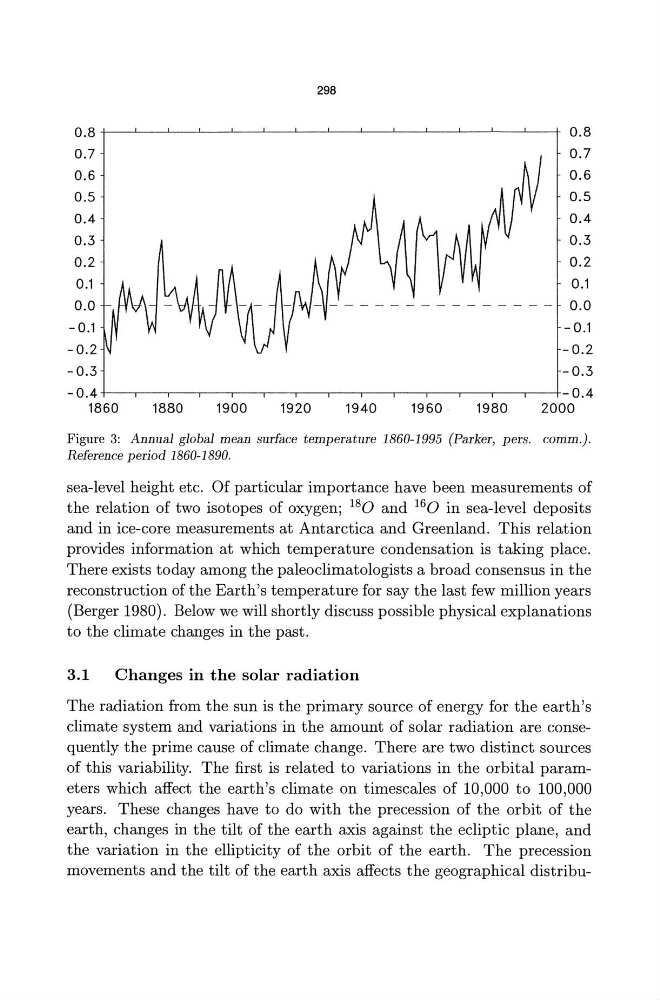
Figure 3: Annual global mean surface temperature 1860-1995 (Parker, pers. comm.).
Reference period 1860-1890.
sea-level height etc. Of particular importance have been measurements of
the relation of two isotopes of oxygen; 18 0 and 16 0 in sea-level deposits
and in ice-core measurements at Antarctica and Greenland. This relation
provides information at which temperature condensation is taking place.
There exists today among the paleo climatologists a broad consensus in the
reconstruction of the Earth's temperature for say the last few million years
(Berger 1980). Below we will shortly discuss possible physical explanations
to the climate changes in the past.
3.1
Changes in the solar radiation
The radiation from the sun is the primary source of energy for the earth's
climate system and variations in the amount of solar radiation are consequently the prime cause of climate change. There are two distinct sources
of this variability. The first is related to variations in the orbital parameters which affect the earth's climate on timescales of 10,000 to 100,000
years. These changes have to do with the precession of the orbit of the
earth, changes in the tilt of the earth axis against the ecliptic plane, and
the variation in the ellipticity of the orbit of the earth. The precession
movements and the tilt of the earth axis affects the geographical distribu-
0.8
0.8
0.7
0.7
0.6
0.6
0.5
0.5
0.4
0.4
0.3
0.3
0.2
0.2
0.1
0.1
0.0
0.0
-0.1
-0.1
-0.2
-0.2
-0.3
-0.3
- 0.4 +---,--,---.--,...-----,----.--,-----,,-----.---.--,----,---.--+- 0.4
1860
1880
1900
1920
1940
1960 .
1980
2000
Figure 3: Annual global mean surface temperature 1860-1995 (Parker, pers. comm.).
Reference period 1860-1890.
sea-level height etc. Of particular importance have been measurements of
the relation of two isotopes of oxygen; 18 0 and 16 0 in sea-level deposits
and in ice-core measurements at Antarctica and Greenland. This relation
provides information at which temperature condensation is taking place.
There exists today among the paleo climatologists a broad consensus in the
reconstruction of the Earth's temperature for say the last few million years
(Berger 1980). Below we will shortly discuss possible physical explanations
to the climate changes in the past.
3.1
Changes in the solar radiation
The radiation from the sun is the primary source of energy for the earth's
climate system and variations in the amount of solar radiation are consequently the prime cause of climate change. There are two distinct sources
of this variability. The first is related to variations in the orbital parameters which affect the earth's climate on timescales of 10,000 to 100,000
years. These changes have to do with the precession of the orbit of the
earth, changes in the tilt of the earth axis against the ecliptic plane, and
the variation in the ellipticity of the orbit of the earth. The precession
movements and the tilt of the earth axis affects the geographical distribu-