

289
autocorrelation
o 2 4 6 8 10 12 14
lag [a]
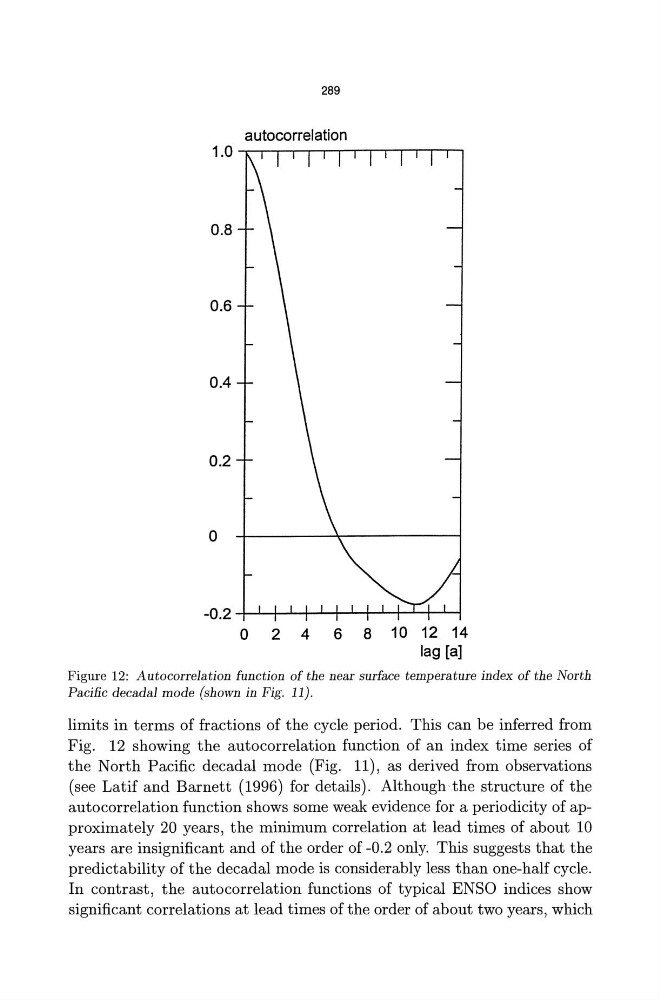
Figure 12: Autocorrelation function of the near surface temperature index of the North
Pacific decadal mode (shown in Fig. 11).
limits in terms of fractions of the cycle period. This can be inferred from
Fig. 12 showing the autocorrelation function of an index time series of
the North Pacific decadal mode (Fig. 11), as derived from observations
(see Latif and Barnett (1996) for details). Although,the structure of the
autocorrelation function shows some weak evidence for a periodicity of approximately 20 years, the minimum correlation at lead times of about 10
years are insignificant and of the order of -0.2 only. This suggests that the
predictability of the decadal mode is considerably less than one-half cycle.
In contrast, the autocorrelation functions of typical ENSO indices show
significant correlations at lead times of the order of about two years, which
autocorrelation
o 2 4 6 8 10 12 14
lag [a]
Figure 12: Autocorrelation function of the near surface temperature index of the North
Pacific decadal mode (shown in Fig. 11).
limits in terms of fractions of the cycle period. This can be inferred from
Fig. 12 showing the autocorrelation function of an index time series of
the North Pacific decadal mode (Fig. 11), as derived from observations
(see Latif and Barnett (1996) for details). Although,the structure of the
autocorrelation function shows some weak evidence for a periodicity of approximately 20 years, the minimum correlation at lead times of about 10
years are insignificant and of the order of -0.2 only. This suggests that the
predictability of the decadal mode is considerably less than one-half cycle.
In contrast, the autocorrelation functions of typical ENSO indices show
significant correlations at lead times of the order of about two years, which