

245
3.6r----.-----.----_r----._----~--_.----_r----._----._--_,
3.5
3.4
3.3
~
::J
"§ 3.2
Q)
a.
E
~ 3.1
«i
.~ 3 .....
o
a..
2.9
2.8
2.7 ..... .
94:
70
. ............... -::.: ..... .
: 28.····:
. .
.
':'.'
.34:7 ..............
---~--.f--------.: ........... : ... ;: .... .
%2.~8~2~3~4~.8~3--3~4~.8~4~~34~.~85~-3~4.L86---3~4.L87---3L4.L8-8--3-4L.8-9~3-4L.9---3-4L.9-1--3~4.92
Bravo Salinity (1000-1500m psu), years marked, sigma-1500 contours
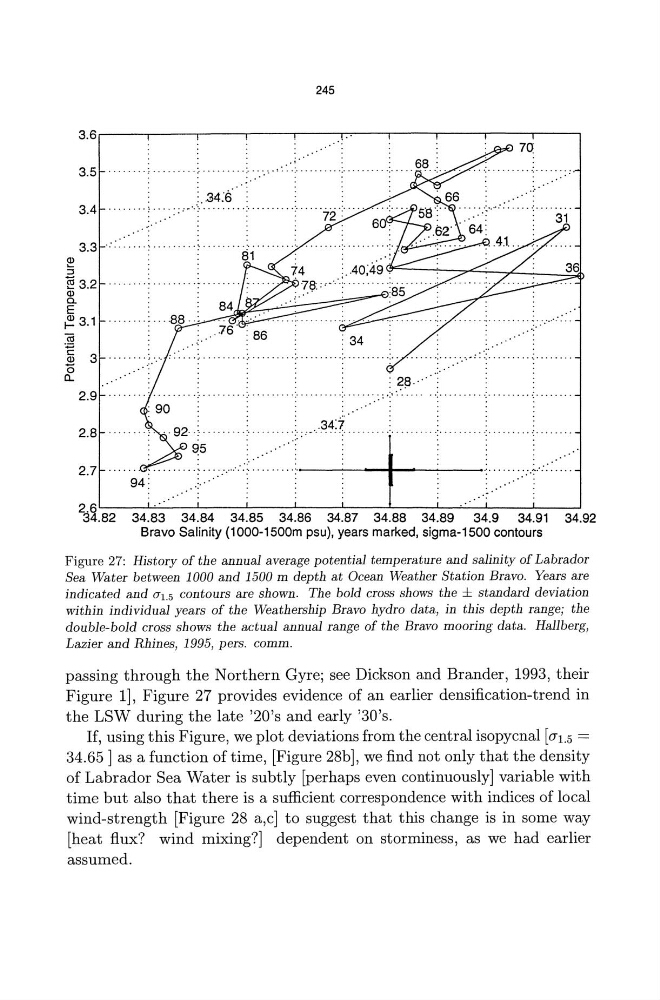
Figure 27: History of the annual average potential temperature and salinity of Labrador
Sea Water between 1000 and 1500 m depth at Ocean Weather Station Bravo. Years are
indicated and 0'1.5 contours are shown. The bold cross shows the ± standard deviation
within individual years of the Weathership Bravo hydro data, in this depth range; the
double-bold cross shows the actual annual range of the Bravo mooring data. Hallberg,
Lazier and Rhines, 1995, pers. comm.
passing through the Northern Gyre; see Dickson and Brander, 1993, their
Figure 1], Figure 27 provides evidence of an earlier densification-trend in
the LSW during the late '20's and early '30's.
If, using this Figure, we plot deviations from the central isopycnal [0'1.5 =
34.65] as a function oftime, [Figure 28b], we find not only that the density
of Labrador Sea Water is subtly [perhaps even continuously] variable with
time but also that there is a sufficient correspondence with indices of local
wind-strength [Figure 28 a,c] to suggest that this change is in some way
[heat flux? wind mixing?] dependent on storminess, as we had earlier
assumed.
3.6r----.-----.----_r----._----~--_.----_r----._----._--_,
3.5
3.4
3.3
~
::J
"§ 3.2
Q)
a.
E
~ 3.1
«i
.~ 3 .....
o
a..
2.9
2.8
2.7 ..... .
94:
70
. ............... -::.: ..... .
: 28.····:
. .
.
':'.'
.34:7 ..............
---~--.f--------.: ........... : ... ;: .... .
%2.~8~2~3~4~.8~3--3~4~.8~4~~34~.~85~-3~4.L86---3~4.L87---3L4.L8-8--3-4L.8-9~3-4L.9---3-4L.9-1--3~4.92
Bravo Salinity (1000-1500m psu), years marked, sigma-1500 contours
Figure 27: History of the annual average potential temperature and salinity of Labrador
Sea Water between 1000 and 1500 m depth at Ocean Weather Station Bravo. Years are
indicated and 0'1.5 contours are shown. The bold cross shows the ± standard deviation
within individual years of the Weathership Bravo hydro data, in this depth range; the
double-bold cross shows the actual annual range of the Bravo mooring data. Hallberg,
Lazier and Rhines, 1995, pers. comm.
passing through the Northern Gyre; see Dickson and Brander, 1993, their
Figure 1], Figure 27 provides evidence of an earlier densification-trend in
the LSW during the late '20's and early '30's.
If, using this Figure, we plot deviations from the central isopycnal [0'1.5 =
34.65] as a function oftime, [Figure 28b], we find not only that the density
of Labrador Sea Water is subtly [perhaps even continuously] variable with
time but also that there is a sufficient correspondence with indices of local
wind-strength [Figure 28 a,c] to suggest that this change is in some way
[heat flux? wind mixing?] dependent on storminess, as we had earlier
assumed.