

243
T vs 5 at LSW T Minimum: 1962-95
3 . 8 - . - - - - - - - - - - - - - - - - - - - - - _ _ _ _ ; < , . - ; r - - - - ; r - - - - ,
3.6
~
:::J
3.4
'§
OJ
D..
E
~
3.2
(iJ
~
OJ
15 3.0
D...
2.8
2.6-1-.L...f--I--f--l--+....c.....+---+----l'---I--t--+---+---+--I--t--+---+---+--l--j
34.75
34.80
34.85
Salinity
34.90
34.95
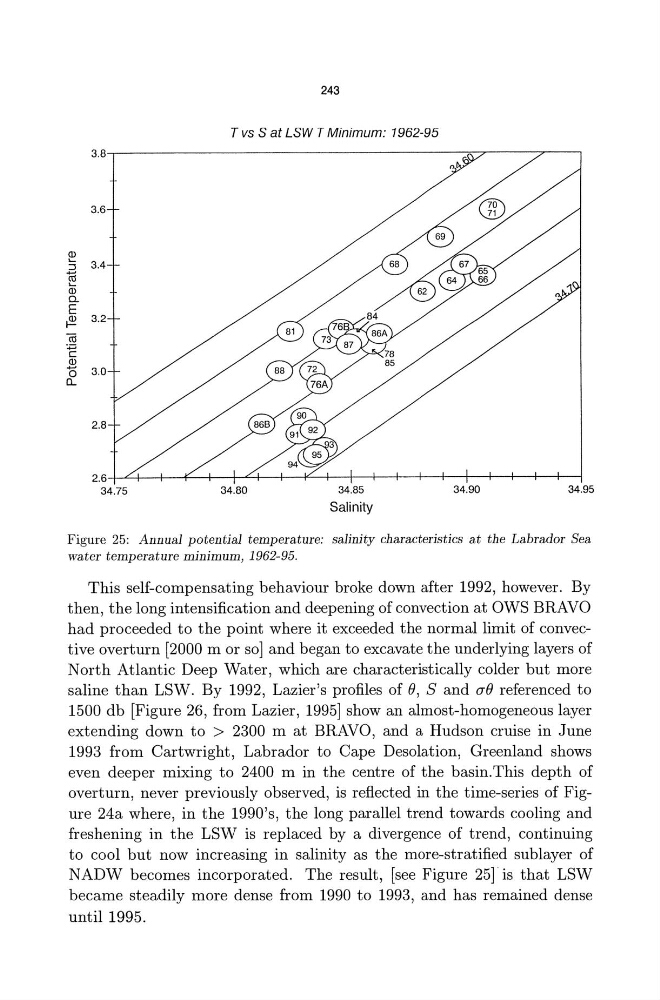
Figure 25: Annual potential temperature: salinity characteristics at the Labrador Sea
water temperature minimum, 1962-95.
This self-compensating behaviour broke down after 1992, however. By
then, the long intensification and deepening of convection at OWS BRAVO
had proceeded to the point where it exceeded the normal limit of convective overturn [2000 m or so] and began to excavate the underlying layers of
North Atlantic Deep Water, which are characteristically colder but more
saline than LSW. By 1992, Lazier's profiles of e, Sand aB referenced to
1500 db [Figure 26, from Lazier, 1995] show an almost-homogeneous layer
extending down to > 2300 m at BRAVO, and a Hudson cruise in June
1993 from Cartwright, Labrador to Cape Desolation, Greenland shows
even deeper mixing to 2400 m in the centre of the basin. This depth of
overturn, never previously observed, is reflected in the time-series of Figure 24a where, in the 1990's, the long parallel trend towards cooling and
freshening in the LSW is replaced by a divergence of trend, continuing
to cool but now increasing in salinity as the more-stratified sublayer of
NADW becomes incorporated. The result, [see Figure 25] is that LSW
became steadily more dense from 1990 to 1993, and has remained dense
until 1995.
T vs 5 at LSW T Minimum: 1962-95
3 . 8 - . - - - - - - - - - - - - - - - - - - - - - _ _ _ _ ; < , . - ; r - - - - ; r - - - - ,
3.6
~
:::J
3.4
'§
OJ
D..
E
~
3.2
(iJ
~
OJ
15 3.0
D...
2.8
2.6-1-.L...f--I--f--l--+....c.....+---+----l'---I--t--+---+---+--I--t--+---+---+--l--j
34.75
34.80
34.85
Salinity
34.90
34.95
Figure 25: Annual potential temperature: salinity characteristics at the Labrador Sea
water temperature minimum, 1962-95.
This self-compensating behaviour broke down after 1992, however. By
then, the long intensification and deepening of convection at OWS BRAVO
had proceeded to the point where it exceeded the normal limit of convective overturn [2000 m or so] and began to excavate the underlying layers of
North Atlantic Deep Water, which are characteristically colder but more
saline than LSW. By 1992, Lazier's profiles of e, Sand aB referenced to
1500 db [Figure 26, from Lazier, 1995] show an almost-homogeneous layer
extending down to > 2300 m at BRAVO, and a Hudson cruise in June
1993 from Cartwright, Labrador to Cape Desolation, Greenland shows
even deeper mixing to 2400 m in the centre of the basin. This depth of
overturn, never previously observed, is reflected in the time-series of Figure 24a where, in the 1990's, the long parallel trend towards cooling and
freshening in the LSW is replaced by a divergence of trend, continuing
to cool but now increasing in salinity as the more-stratified sublayer of
NADW becomes incorporated. The result, [see Figure 25] is that LSW
became steadily more dense from 1990 to 1993, and has remained dense
until 1995.