

230
North Atlantic Oscillation Index
~r-----~------r------r------.------r------~
20
15
10
5
-. . . _ . . . : .. r:·:·~ . ' . . -. . . . . .
o
-5 ............... ..
-10 .................. ..
....... ...... ····r·················· ·l·· . . · · · · · · · · · · · · · . "
r
-15 ..................... : ................ ...... ~ ....................... L ......•.......... ............................. ;. ..........•........ ;. ..
_··_···_·,······_·_···i-······_···[·_·__··_-\_··_·__··;
-20 .................... .
_~~ ________ ~ ________ ~ _ _ _ _ ~~ _ _ _ _ ~ _ _ _ _ _ _ ~ _ _ _ _ - - U
1860
1880
1900
1920
1940
1960
1980
Year
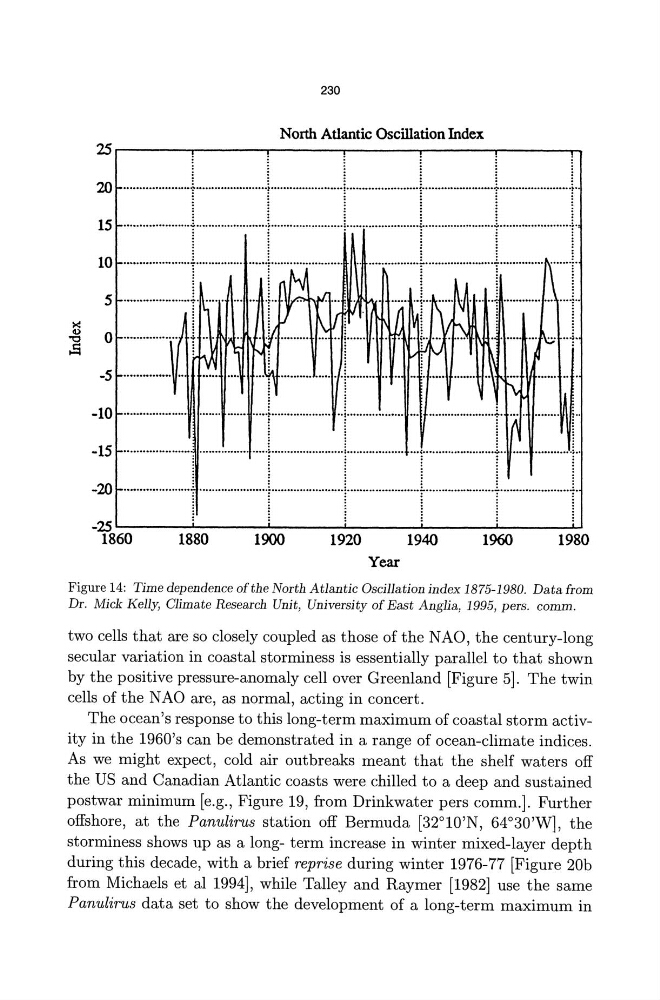
Figure 14: Time dependence ofthe North Atlantic Oscillation index 1875-1980. Data from
Dr. Mick Kelly, Climate Research Unit, University of East Anglia, 1995, pers. comm.
two cells that are so closely coupled as those ofthe NAO, the century-long
secular variation in coastal storminess is essentially parallel to that shown
by the positive pressure-anomaly cell over Greenland [Figure 5]. The twin
cells of the NAO are, as normal, acting in concert.
The ocean's response to this long-term maximum of coastal storm activity in the 1960's can be demonstrated in a range of ocean-climate indices.
As we might expect, cold air outbreaks meant that the shelf waters off
the US and Canadian Atlantic coasts were chilled to a deep and sustained
postwar minimum [e.g., Figure 19, from Drinkwater pers comm.]. Further
offshore, at the Panulirus station off Bermuda [32°10'N, 64°30'W], the
storminess shows up as a long- term increase in winter mixed-layer depth
during this decade, with a brief reprise during winter 1976-77 [Figure 20b
from Michaels et al 1994], while Talley and Raymer [1982] use the same
Panulirus data set to show the development of a long-term maximum in
North Atlantic Oscillation Index
~r-----~------r------r------.------r------~
20
15
10
5
-. . . _ . . . : .. r:·:·~ . ' . . -. . . . . .
o
-5 ............... ..
-10 .................. ..
....... ...... ····r·················· ·l·· . . · · · · · · · · · · · · · . "
r
-15 ..................... : ................ ...... ~ ....................... L ......•.......... ............................. ;. ..........•........ ;. ..
_··_···_·,······_·_···i-······_···[·_·__··_-\_··_·__··;
-20 .................... .
_~~ ________ ~ ________ ~ _ _ _ _ ~~ _ _ _ _ ~ _ _ _ _ _ _ ~ _ _ _ _ - - U
1860
1880
1900
1920
1940
1960
1980
Year
Figure 14: Time dependence ofthe North Atlantic Oscillation index 1875-1980. Data from
Dr. Mick Kelly, Climate Research Unit, University of East Anglia, 1995, pers. comm.
two cells that are so closely coupled as those ofthe NAO, the century-long
secular variation in coastal storminess is essentially parallel to that shown
by the positive pressure-anomaly cell over Greenland [Figure 5]. The twin
cells of the NAO are, as normal, acting in concert.
The ocean's response to this long-term maximum of coastal storm activity in the 1960's can be demonstrated in a range of ocean-climate indices.
As we might expect, cold air outbreaks meant that the shelf waters off
the US and Canadian Atlantic coasts were chilled to a deep and sustained
postwar minimum [e.g., Figure 19, from Drinkwater pers comm.]. Further
offshore, at the Panulirus station off Bermuda [32°10'N, 64°30'W], the
storminess shows up as a long- term increase in winter mixed-layer depth
during this decade, with a brief reprise during winter 1976-77 [Figure 20b
from Michaels et al 1994], while Talley and Raymer [1982] use the same
Panulirus data set to show the development of a long-term maximum in