

222
15Q '
180'
150'
30'
o·
30'
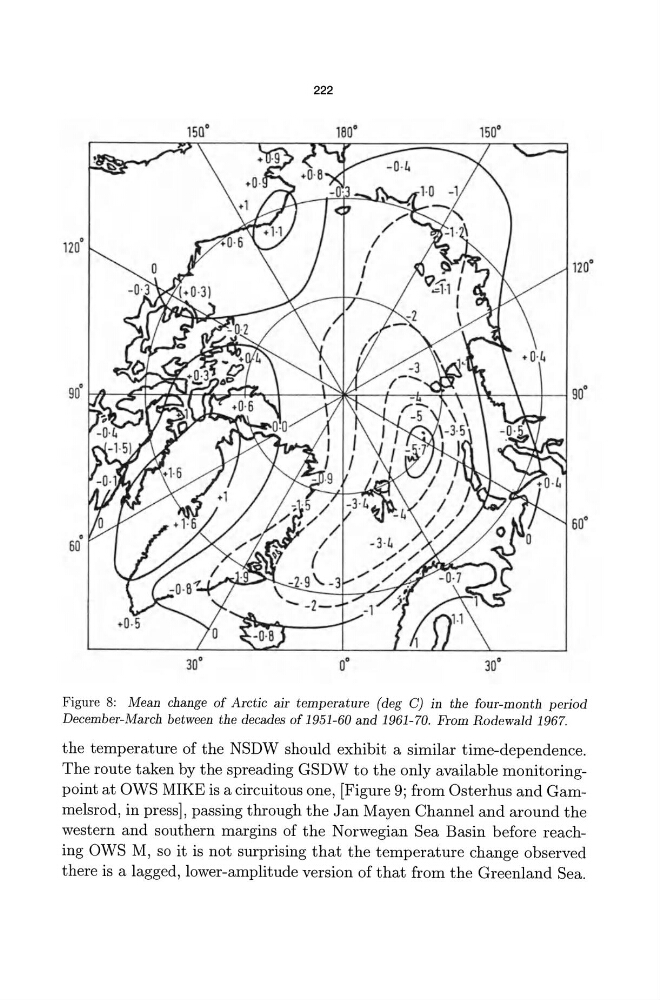
Figure 8: Mean change of Arctic air temperature (deg C) in the four-month period
December-March between the decades of 1951-60 and 1961-70. Prom Rodewald 1967.
the temperature of the NSDW should exhibit a similar time-dependence.
The route taken by the spreading GSDW to the only available monitoringpoint at OWS MIKE is a circuitous one, [Figure 9; from Osterhus and Gammelsrod, in press], passing through the Jan Mayen Channel and around the
western and southern margins of the Norwegian Sea Basin before reaching OWS M, so it is not surprising that the temperature change observed
there is a lagged, lower-amplitude version of that from the Greenland Sea.
15Q '
180'
150'
30'
o·
30'
Figure 8: Mean change of Arctic air temperature (deg C) in the four-month period
December-March between the decades of 1951-60 and 1961-70. Prom Rodewald 1967.
the temperature of the NSDW should exhibit a similar time-dependence.
The route taken by the spreading GSDW to the only available monitoringpoint at OWS MIKE is a circuitous one, [Figure 9; from Osterhus and Gammelsrod, in press], passing through the Jan Mayen Channel and around the
western and southern margins of the Norwegian Sea Basin before reaching OWS M, so it is not surprising that the temperature change observed
there is a lagged, lower-amplitude version of that from the Greenland Sea.