

~
8 0
'iii
"oS
'C
a
I
'0
~
10
0
":
0
.,
0
~
0
0
0
219
10
ci
'" ci
q
o
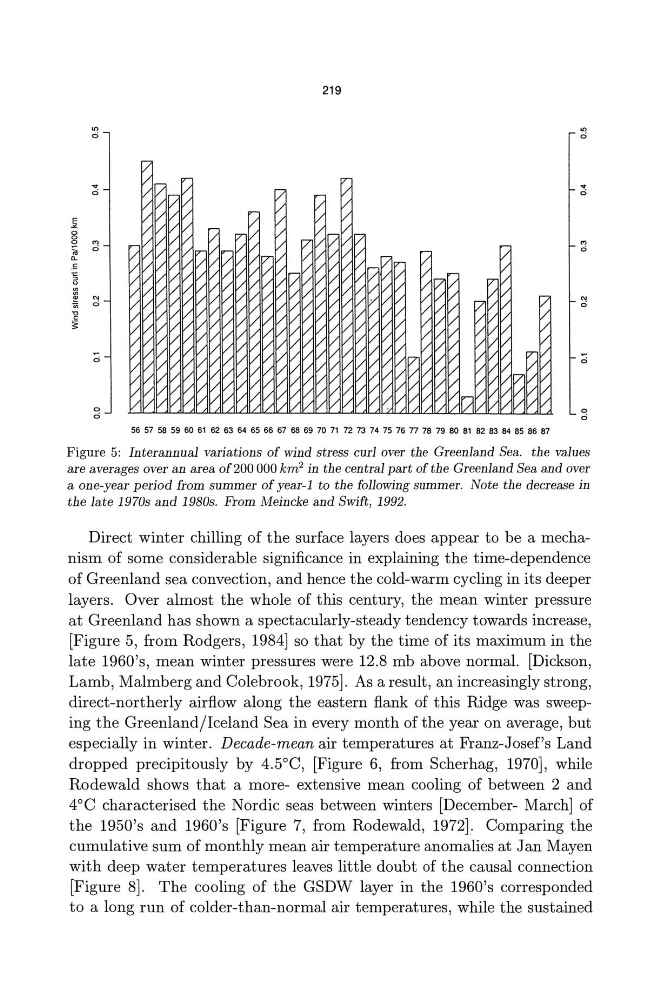
Figure 5: Interannual variations of wind stress curl over the Greenland Sea. the values
are averages over an area of200 000 km 2 in the central part of the Greenland Sea and over
a one-year period from summer of year-1 to the following summer. Note the decrease in
the late 1970s and 1980s. From Meincke and Swift, 1992.
Direct winter chilling of the surface layers does appear to be a mechanism of some considerable significance in explaining the time-dependence
of Greenland sea convection, and hence the cold-warm cycling in its deeper
layers. Over almost the whole of this century, the mean winter pressure
at Greenland has shown a spectacularly-steady tendency towards increase,
[Figure 5, from Rodgers, 1984] so that by the time of its maximum in the
late 1960's, mean winter pressures were 12.8 mb above normal. [Dickson,
Lamb, Malmberg and Colebrook, 1975]. As a result, an increasingly strong,
direct-northerly airflow along the eastern flank of this Ridge was sweeping the Greenland/Iceland Sea in every month of the year on average, but
especially in winter. Decade-mean air temperatures at Franz-Josef's Land
dropped precipitously by 4.5°C, [Figure 6, from Scherhag, 1970], while
Rodewald shows that a more- extensive mean cooling of between 2 and
4°C characterised the Nordic seas between winters [December- March] of
the 1950's and 1960's [Figure 7, from Rodewald, 1972),. Comparing the
cumulative sum of monthly mean air temperature anomalies at Jan Mayen
with deep water temperatures leaves little doubt of the causal connection
[Figure 8]. The cooling of the GSDW layer in the 1960's corresponded
to a long run of colder-than-normal air temperatures, while the sustained
8 0
'iii
"oS
'C
a
I
'0
~
10
0
":
0
.,
0
~
0
0
0
219
10
ci
'" ci
q
o
Figure 5: Interannual variations of wind stress curl over the Greenland Sea. the values
are averages over an area of200 000 km 2 in the central part of the Greenland Sea and over
a one-year period from summer of year-1 to the following summer. Note the decrease in
the late 1970s and 1980s. From Meincke and Swift, 1992.
Direct winter chilling of the surface layers does appear to be a mechanism of some considerable significance in explaining the time-dependence
of Greenland sea convection, and hence the cold-warm cycling in its deeper
layers. Over almost the whole of this century, the mean winter pressure
at Greenland has shown a spectacularly-steady tendency towards increase,
[Figure 5, from Rodgers, 1984] so that by the time of its maximum in the
late 1960's, mean winter pressures were 12.8 mb above normal. [Dickson,
Lamb, Malmberg and Colebrook, 1975]. As a result, an increasingly strong,
direct-northerly airflow along the eastern flank of this Ridge was sweeping the Greenland/Iceland Sea in every month of the year on average, but
especially in winter. Decade-mean air temperatures at Franz-Josef's Land
dropped precipitously by 4.5°C, [Figure 6, from Scherhag, 1970], while
Rodewald shows that a more- extensive mean cooling of between 2 and
4°C characterised the Nordic seas between winters [December- March] of
the 1950's and 1960's [Figure 7, from Rodewald, 1972),. Comparing the
cumulative sum of monthly mean air temperature anomalies at Jan Mayen
with deep water temperatures leaves little doubt of the causal connection
[Figure 8]. The cooling of the GSDW layer in the 1960's corresponded
to a long run of colder-than-normal air temperatures, while the sustained