

201
SURFACE HEAT FLUX - SUBPOLAR N. ATL.
250
200
. __ .... ..... .................... __ .. - .. . ......... . . ....... .
·
.
·
.
·
.
~ 150
(a)
~
;: 100
r-.vARM · .. · .. : .....
50
0
6000
7000
8000
9000
10000
11000
12000
TIME (YEARS)
BASIN MEAN TEMPERATURE
8r------.-------.-------.------,-------.------.
COLD :
(b)
5
WARM
4 C=====c=====c=====~====~====t===~
6000
7000
8000
9000
10000
11000
12000
TIME (YEARS)
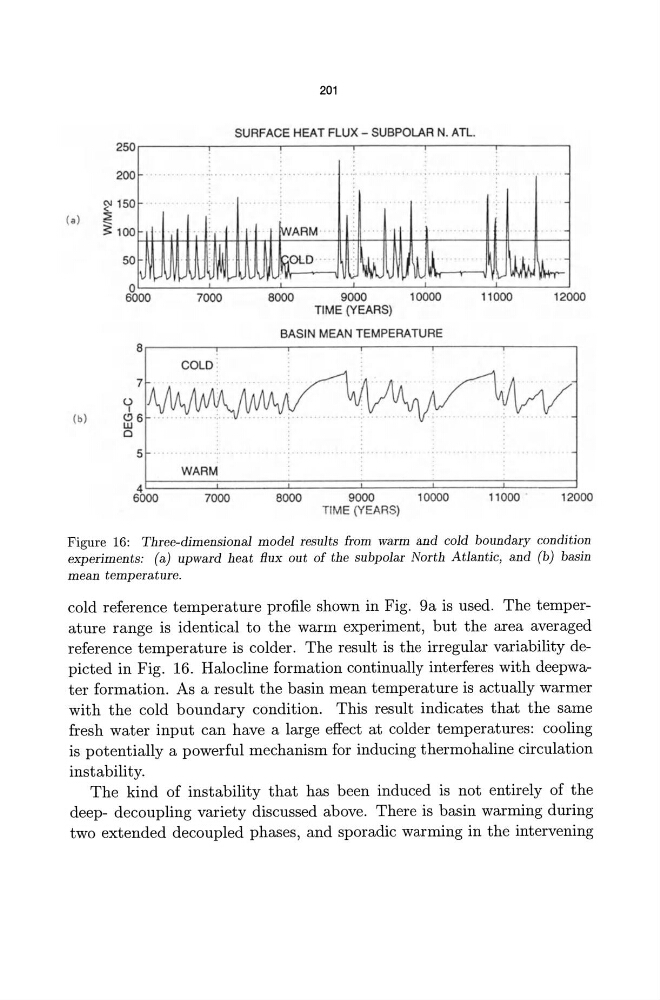
Figure 16: Three-dimensional model results from warm and cold boundary condition
experiments: (a) upward heat flux out of the subpolar North Atlantic, and (b) basin
mean temperature.
cold reference temperature profile shown in Fig. 9a is used. The temperature range is identical to the warm experiment, but the area averaged
reference temperature is colder. The result is the irregular variability depicted in Fig. 16. Halocline formation continually interferes with deepwater formation. As a result the basin mean temperature is actually warmer
with the cold boundary condition. This result indicates that the same
fresh water input can have a large effect at colder temperatures: cooling
is potentially a powerful mechanism for inducing thermohaline circulation
instability.
The kind of instability that has been induced is not entirely of the
deep- decoupling variety discussed above. There is basin warming during
two extended decoupled phases, and sporadic warming in the intervening
SURFACE HEAT FLUX - SUBPOLAR N. ATL.
250
200
. __ .... ..... .................... __ .. - .. . ......... . . ....... .
·
.
·
.
·
.
~ 150
(a)
~
;: 100
r-.vARM · .. · .. : .....
50
0
6000
7000
8000
9000
10000
11000
12000
TIME (YEARS)
BASIN MEAN TEMPERATURE
8r------.-------.-------.------,-------.------.
COLD :
(b)
5
WARM
4 C=====c=====c=====~====~====t===~
6000
7000
8000
9000
10000
11000
12000
TIME (YEARS)
Figure 16: Three-dimensional model results from warm and cold boundary condition
experiments: (a) upward heat flux out of the subpolar North Atlantic, and (b) basin
mean temperature.
cold reference temperature profile shown in Fig. 9a is used. The temperature range is identical to the warm experiment, but the area averaged
reference temperature is colder. The result is the irregular variability depicted in Fig. 16. Halocline formation continually interferes with deepwater formation. As a result the basin mean temperature is actually warmer
with the cold boundary condition. This result indicates that the same
fresh water input can have a large effect at colder temperatures: cooling
is potentially a powerful mechanism for inducing thermohaline circulation
instability.
The kind of instability that has been induced is not entirely of the
deep- decoupling variety discussed above. There is basin warming during
two extended decoupled phases, and sporadic warming in the intervening