

11
70
75
80
85
90
95
00
05
10
15
1905-1954
~~~ "
.1*ldL ~. . Jv~
.
r ."" ... .. '.~,
V"...,' If 1'"
,
05
10
15
20
25
30
35
40
45
50
55
1945-1992
",n'
If L"..y.Jl'~
,,),,~
45
50
55
60
65
70
75
80
85
90
95
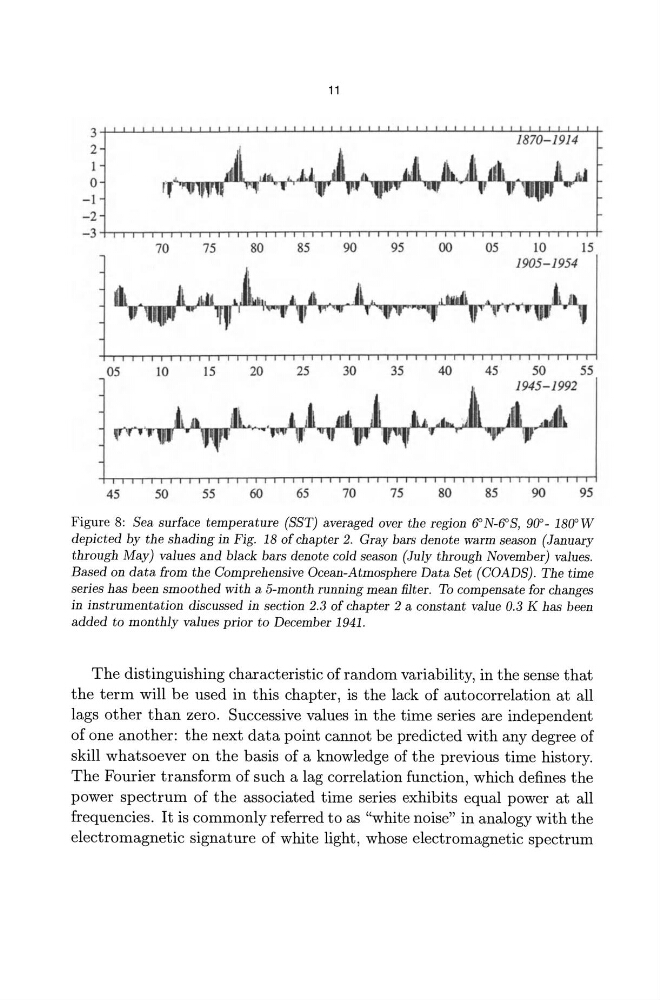
Figure 8: Sea surface temperature (SST) averaged over the region 6"N-6"S, 9(J'- 18(J'W
depicted by the shading in Fig. 18 of chapter 2. Gray bars denote warm season (January
through May) values and black bars denote cold season (July through November) values.
Based on data from the Comprehensive Ocean-Atmosphere Data Set (COADS) . The time
series has been smoothed with a 5-month running mean filter. To compensate for changes
in instrumentation discussed in section 2.3 of chapter 2 a constant value 0.3 K has been
added to monthly values prior to December 1941.
The distinguishing characteristic of random variability, in the sense that
the term will be used in this chapter, is the lack of autocorrelation at all
lags other than zero. Successive values in the time series are independent
of one another: the next data point cannot be predicted with any degree of
skill whatsoever on the basis of a knowledge of the previous time history.
The Fourier transform of such a lag correlation function, which defines the
power spectrum of the associated time series exhibits equal power at all
frequencies. It is commonly referred to as "white noise" in analogy with the
electromagnetic signature of white light, whose electromagnetic spectrum
70
75
80
85
90
95
00
05
10
15
1905-1954
~~~ "
.1*ldL ~. . Jv~
.
r ."" ... .. '.~,
V"...,' If 1'"
,
05
10
15
20
25
30
35
40
45
50
55
1945-1992
",n'
If L"..y.Jl'~
,,),,~
45
50
55
60
65
70
75
80
85
90
95
Figure 8: Sea surface temperature (SST) averaged over the region 6"N-6"S, 9(J'- 18(J'W
depicted by the shading in Fig. 18 of chapter 2. Gray bars denote warm season (January
through May) values and black bars denote cold season (July through November) values.
Based on data from the Comprehensive Ocean-Atmosphere Data Set (COADS) . The time
series has been smoothed with a 5-month running mean filter. To compensate for changes
in instrumentation discussed in section 2.3 of chapter 2 a constant value 0.3 K has been
added to monthly values prior to December 1941.
The distinguishing characteristic of random variability, in the sense that
the term will be used in this chapter, is the lack of autocorrelation at all
lags other than zero. Successive values in the time series are independent
of one another: the next data point cannot be predicted with any degree of
skill whatsoever on the basis of a knowledge of the previous time history.
The Fourier transform of such a lag correlation function, which defines the
power spectrum of the associated time series exhibits equal power at all
frequencies. It is commonly referred to as "white noise" in analogy with the
electromagnetic signature of white light, whose electromagnetic spectrum