

6
40~
ATMOSPHERIC OZON~E AROSA SWITZERLAND (46.5°N.9.4°E)
350
300_
250L----+-----~---+1~1~9~32~~19~3~3~~19~3~4~~1~93~5~~19~3~6-+~1~9~37~
350
300
400~
::2:
U 250 •
7~~
2 400
350
300
250 1 9 4 7 i 9 4 8 i 9 4 9 i 9 5 I 19541955
400~
350
300
250 ~19=5=6-+-=19-=5=7 -j-"""lg::-::5' ""S-+""""' 1""9-:=-59;o--l----;-19' ' ""' 6' "' ' O' ' -+--c1 ' ' ' ' 9-:::67""1 -+--1"'9~6"2 -+'~19"6'"'"3-+~1""9""64-;;-t-'
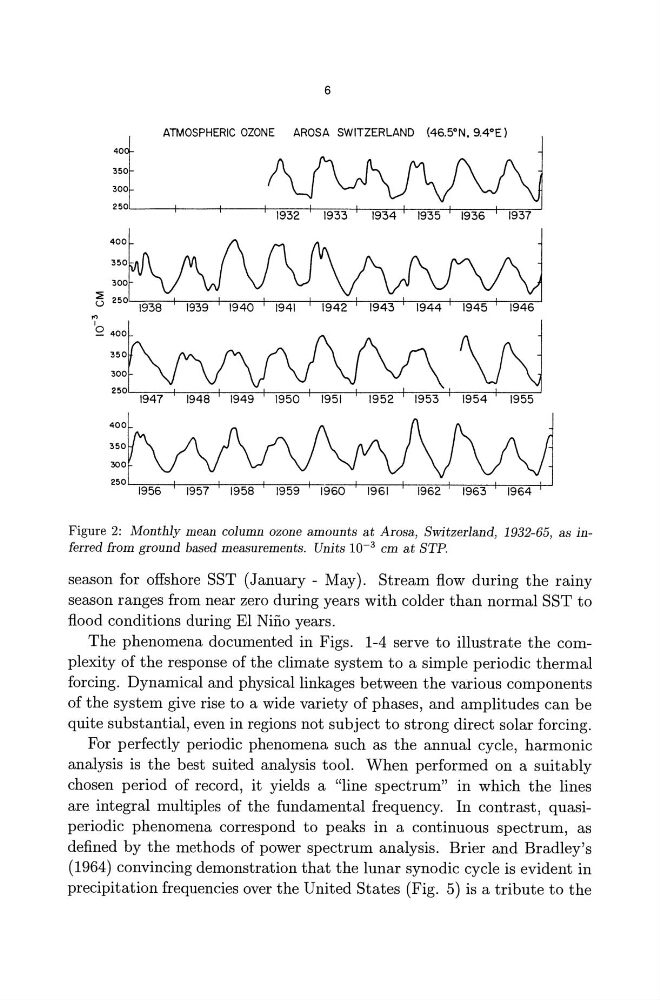
Figure 2: Monthly mean column ozone amounts at Arosa, Switzerland, 1932-65, as inferred from ground based measurements. Units 10- 3 cm at STP.
season for offshore SST (January - May). Stream flow during the rainy
season ranges from near zero during years with colder than normal SST to
flood conditions during El Nino years.
The phenomena documented in Figs. 1-4 serve to illustrate the complexity of the response of the climate system to a simple periodic thermal
forcing. Dynamical and physical linkages between the various components
of the system give rise to a wide variety of phases, and amplitudes can be
quite substantial, even in regions not subject to strong direct solar forcing.
For perfectly periodic phenomena such as the annual cycle, harmonic
analysis is the best suited analysis tool. When performed on a suitably
chosen period of record, it yields a "line spectrum" in which the lines
are integral multiples of the fundamental frequency. In contrast, quasiperiodic phenomena correspond to peaks in a continuous spectrum, as
defined by the methods of power spectrum analysis. Brier and Bradley's
(1964) convincing demonstration that the lunar synodic cycle is evident in
precipitation frequencies over the United States (Fig. 5) is a tribute to the
40~
ATMOSPHERIC OZON~E AROSA SWITZERLAND (46.5°N.9.4°E)
350
300_
250L----+-----~---+1~1~9~32~~19~3~3~~19~3~4~~1~93~5~~19~3~6-+~1~9~37~
350
300
400~
::2:
U 250 •
7~~
2 400
350
300
250 1 9 4 7 i 9 4 8 i 9 4 9 i 9 5 I 19541955
400~
350
300
250 ~19=5=6-+-=19-=5=7 -j-"""lg::-::5' ""S-+""""' 1""9-:=-59;o--l----;-19' ' ""' 6' "' ' O' ' -+--c1 ' ' ' ' 9-:::67""1 -+--1"'9~6"2 -+'~19"6'"'"3-+~1""9""64-;;-t-'
Figure 2: Monthly mean column ozone amounts at Arosa, Switzerland, 1932-65, as inferred from ground based measurements. Units 10- 3 cm at STP.
season for offshore SST (January - May). Stream flow during the rainy
season ranges from near zero during years with colder than normal SST to
flood conditions during El Nino years.
The phenomena documented in Figs. 1-4 serve to illustrate the complexity of the response of the climate system to a simple periodic thermal
forcing. Dynamical and physical linkages between the various components
of the system give rise to a wide variety of phases, and amplitudes can be
quite substantial, even in regions not subject to strong direct solar forcing.
For perfectly periodic phenomena such as the annual cycle, harmonic
analysis is the best suited analysis tool. When performed on a suitably
chosen period of record, it yields a "line spectrum" in which the lines
are integral multiples of the fundamental frequency. In contrast, quasiperiodic phenomena correspond to peaks in a continuous spectrum, as
defined by the methods of power spectrum analysis. Brier and Bradley's
(1964) convincing demonstration that the lunar synodic cycle is evident in
precipitation frequencies over the United States (Fig. 5) is a tribute to the