

5
220-r-~---'---'----'----'----"----t'
218 extratropics
216
214
212 whole globe
210
208
206 tropics
204--202~...,......~~-_ _ -.......-_-.-_-...---J.
J F M A M J J ASOND
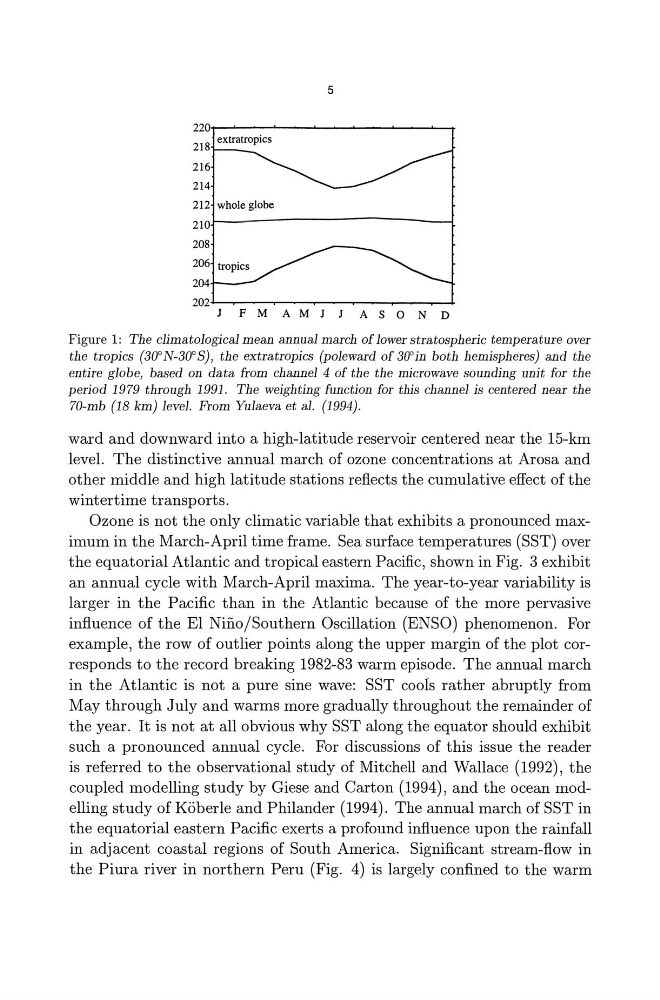
Figure 1: The climatological mean annual march of lower stratospheric temperature over
the tropics (3(J'N-3(J'S) , the extratropics (poleward of 3(fin both hemispheres) and the
entire globe, based on data from channel 4 of the the microwave sounding unit for the
period 1979 through 1991. The weighting function for this channel is centered near the
70-mb (18 km) level. From Yulaeva et al. (1994).
ward and downward into a high-latitude reservoir centered near the 15-km
level. The distinctive annual march of ozone concentrations at Arosa and
other middle and high latitude stations reflects the cumulative effect of the
wintertime transports.
Ozone is not the only climatic variable that exhibits a pronounced maximum in the March-April time frame. Sea surface temperatures (SST) over
the equatorial Atlantic and tropical eastern Pacific, shown in Fig. 3 exhibit
an annual cycle with March-April maxima. The year-to-year variability is
larger in the Pacific than in the Atlantic because of the more pervasive
influence of the EI Nino/Southern Oscillation (ENSO) phenomenon. For
example, the row of outlier points along the upper margin of the plot corresponds to the record breaking 1982-83 warm episode. The annual march
in the Atlantic is not a pure sine wave: SST cools rather abruptly from
May through July and warms more gradually throughout the remainder of
the year. It is not at all obvious why SST along the equator should exhibit
such a pronounced annual cycle. For discussions of this issue the reader
is referred to the observational study of Mitchell and Wallace (1992), the
coupled modelling study by Giese and Carton (1994), and the ocean modelling study of Koberle and Philander (1994). The annual march of SST in
the equatorial eastern Pacific exerts a profound influence upon the rainfall
in adjacent coastal regions of South America. Significant stream-flow in
the Piura river in northern Peru (Fig. 4) is largely confined to the warm
220-r-~---'---'----'----'----"----t'
218 extratropics
216
214
212 whole globe
210
208
206 tropics
204--202~...,......~~-_ _ -.......-_-.-_-...---J.
J F M A M J J ASOND
Figure 1: The climatological mean annual march of lower stratospheric temperature over
the tropics (3(J'N-3(J'S) , the extratropics (poleward of 3(fin both hemispheres) and the
entire globe, based on data from channel 4 of the the microwave sounding unit for the
period 1979 through 1991. The weighting function for this channel is centered near the
70-mb (18 km) level. From Yulaeva et al. (1994).
ward and downward into a high-latitude reservoir centered near the 15-km
level. The distinctive annual march of ozone concentrations at Arosa and
other middle and high latitude stations reflects the cumulative effect of the
wintertime transports.
Ozone is not the only climatic variable that exhibits a pronounced maximum in the March-April time frame. Sea surface temperatures (SST) over
the equatorial Atlantic and tropical eastern Pacific, shown in Fig. 3 exhibit
an annual cycle with March-April maxima. The year-to-year variability is
larger in the Pacific than in the Atlantic because of the more pervasive
influence of the EI Nino/Southern Oscillation (ENSO) phenomenon. For
example, the row of outlier points along the upper margin of the plot corresponds to the record breaking 1982-83 warm episode. The annual march
in the Atlantic is not a pure sine wave: SST cools rather abruptly from
May through July and warms more gradually throughout the remainder of
the year. It is not at all obvious why SST along the equator should exhibit
such a pronounced annual cycle. For discussions of this issue the reader
is referred to the observational study of Mitchell and Wallace (1992), the
coupled modelling study by Giese and Carton (1994), and the ocean modelling study of Koberle and Philander (1994). The annual march of SST in
the equatorial eastern Pacific exerts a profound influence upon the rainfall
in adjacent coastal regions of South America. Significant stream-flow in
the Piura river in northern Peru (Fig. 4) is largely confined to the warm