

130
J
90·W
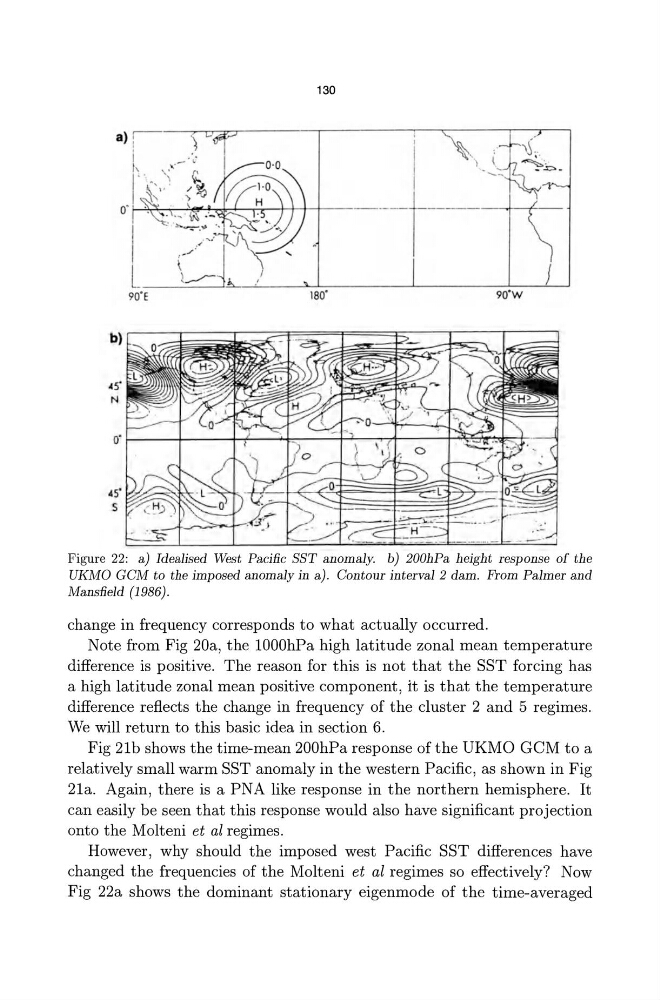
Figure 22: a) Idealised West Pacific SST anomaly. b) 200hPa height response of the
UKMO GCM to the imposed anomaly in a). Contour interval 2 dam . From Palmer and
Mansfield (1986) .
change in frequency corresponds to what actually occurred.
Note from Fig 20a, the lOOOhPa high latitude zonal mean temperature
difference is positive. The reason for this is not that the SST forcing has
a high latitude zonal mean positive component, it is that the temperature
difference reflects the change in frequency of the cluster 2 and 5 regimes.
We will return to this basic idea in section 6.
Fig 21b shows the time-mean 200hPa response of the UKMO GeM to a
relatively small warm SST anomaly in the western Pacific, as shown in Fig
21a. Again, there is a PNA like response in the northern hemisphere. It
can easily be seen that this response would also have significant projection
onto the Molteni et al regimes.
However, why should the imposed west Pacific SST differences have
changed the frequencies of the Molteni et al regimes so effectively? Now
Fig 22a shows the dominant stationary eigenmode of the time-averaged
J
90·W
Figure 22: a) Idealised West Pacific SST anomaly. b) 200hPa height response of the
UKMO GCM to the imposed anomaly in a). Contour interval 2 dam . From Palmer and
Mansfield (1986) .
change in frequency corresponds to what actually occurred.
Note from Fig 20a, the lOOOhPa high latitude zonal mean temperature
difference is positive. The reason for this is not that the SST forcing has
a high latitude zonal mean positive component, it is that the temperature
difference reflects the change in frequency of the cluster 2 and 5 regimes.
We will return to this basic idea in section 6.
Fig 21b shows the time-mean 200hPa response of the UKMO GeM to a
relatively small warm SST anomaly in the western Pacific, as shown in Fig
21a. Again, there is a PNA like response in the northern hemisphere. It
can easily be seen that this response would also have significant projection
onto the Molteni et al regimes.
However, why should the imposed west Pacific SST differences have
changed the frequencies of the Molteni et al regimes so effectively? Now
Fig 22a shows the dominant stationary eigenmode of the time-averaged