

188
Q)
"D
:l
~
-
IQ
..J
M.B. Framiiian . M.P. Etala . E.M. Acha . R. A. Guerrero· C.A. Lasta . O.B. Brown
-34+-----~----~----~----~
-35
-36
Summer
-37
-34
-35
-36
Winter
-37+-----~~--r_--_,----_+
-58
-57
-56
-55
-54 -58
-57
-56
-55
Longitude
2 3 4 5 6 7 8 9 10 11 12 13 14 15 16 17
Frontal density (><10- 5 km- 2 )
-54
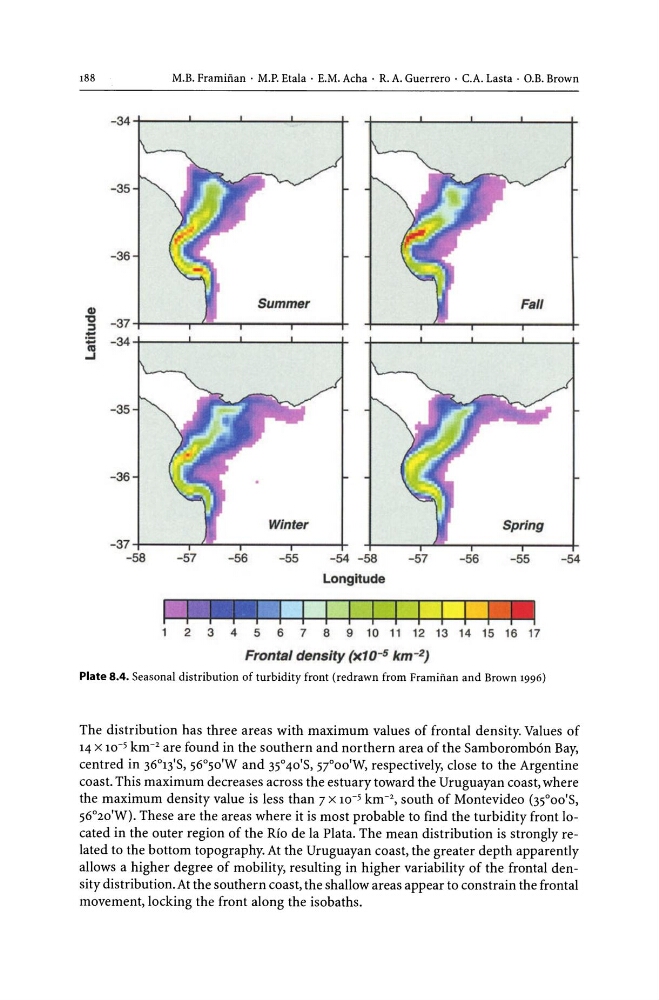
Plate 8.4. Seasonal distribution of turbidity front (redrawn from Framiiian and Brown 1996)
The distribution has three areas with maximum values of frontal density. Values of
14 x 10-5 km- 2 are found in the southern and northern area of the Samboromb6n Bay,
centred in 36°13'S, 56°50'W and 35° 40'S, 57°00'W, respectively, close to the Argentine
coast. This maximum decreases across the estuary toward the Uruguayan coast, where
the maximum density value is less than 7 x 10⁻⁵ km- 2 , south of Montevideo (35°00'S,
56°20'W). These are the areas where it is most probable to find the turbidity front located in the outer region of the Rio de la Plata. The mean distribution is strongly related to the bottom topography. At the Uruguayan coast, the greater depth apparently
allows a higher degree of mobility, resulting in higher variability of the frontal density distribution. At the southern coast, the shallow areas appear to constrain the frontal
movement, locking the front along the isobaths.
Q)
"D
:l
~
-
IQ
..J
M.B. Framiiian . M.P. Etala . E.M. Acha . R. A. Guerrero· C.A. Lasta . O.B. Brown
-34+-----~----~----~----~
-35
-36
Summer
-37
-34
-35
-36
Winter
-37+-----~~--r_--_,----_+
-58
-57
-56
-55
-54 -58
-57
-56
-55
Longitude
2 3 4 5 6 7 8 9 10 11 12 13 14 15 16 17
Frontal density (><10- 5 km- 2 )
-54
Plate 8.4. Seasonal distribution of turbidity front (redrawn from Framiiian and Brown 1996)
The distribution has three areas with maximum values of frontal density. Values of
14 x 10-5 km- 2 are found in the southern and northern area of the Samboromb6n Bay,
centred in 36°13'S, 56°50'W and 35° 40'S, 57°00'W, respectively, close to the Argentine
coast. This maximum decreases across the estuary toward the Uruguayan coast, where
the maximum density value is less than 7 x 10⁻⁵ km- 2 , south of Montevideo (35°00'S,
56°20'W). These are the areas where it is most probable to find the turbidity front located in the outer region of the Rio de la Plata. The mean distribution is strongly related to the bottom topography. At the Uruguayan coast, the greater depth apparently
allows a higher degree of mobility, resulting in higher variability of the frontal density distribution. At the southern coast, the shallow areas appear to constrain the frontal
movement, locking the front along the isobaths.