

CHAPTER 8 . Physical Characteristics and Processes of the Rio de la Plata Estuary
The relationships between turbidity maximum and estuarine circulation, physicochemical processes, tidal-stirring, sediment dynamics and stability of the water column have been extensively reviewed in estuarine literature (e.g., Postma 1967;
Schubel 1968; Officer 1976; Allen et al. 1976; Schubel and Carter 1976, 1983; Dyer 1986,
1995; Geyer 1993). Differences in the location of the turbidity maximum are associated with variation in tidal regime, river flow, and sedimentological processes (Allen
et al. 1980; Gelfenbaum 1983; Uncles et al. 1985; Uncles and Stephens 1989). However,
over long-term time scales, the turbidity maximum occurs near the landward limit of
the salt water intrusion (Dyer 1986, 1995; Grabemann and Krause 1989). A relationship
between the frontal location and stability of the water column is then expected. Based
on archived hydrographic data, Framiftan and Brown (1996) com-puted the stratification parameter {~S / h}, where ~s is the bottom-surface salinity difference and h is
the total depth (Plate 8.3d). A good visual correlation exists between the areas of maximum gradient and the areas with maximum frontal density, i.e., the locations of the
salinity intrusion and the satellite-derived loci are in good agreement.
8.6.2
Seasonal Distribution
Framiftan and Brown (1996) also developed monthly, seasonal, and annual analyses
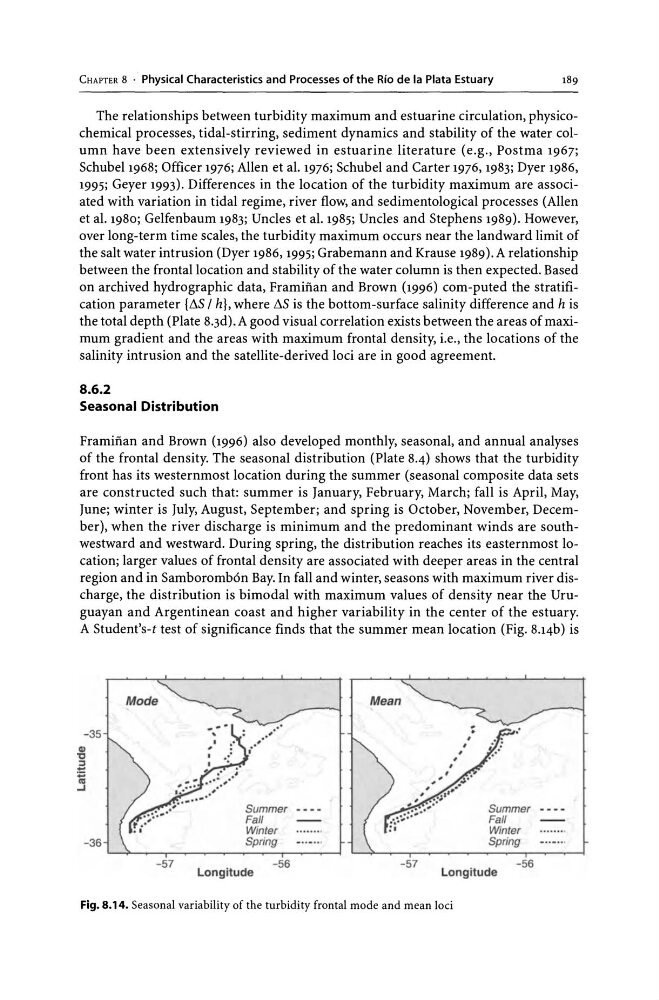
of the frontal density. The seasonal distribution (Plate 8.4) shows that the turbidity
front has its westernmost location during the summer (seasonal composite data sets
are constructed such that: summer is January, February, March; fall is April, May,
June; winter is July, August, September; and spring is October, November, December), when the river discharge is minimum and the predominant winds are southwestward and westward. During spring, the distribution reaches its easternmost location; larger values of frontal density are associated with deeper areas in the central
region and in Samboromb6n Bay. In fall and winter, seasons with maximum river discharge, the distribution is bimodal with maximum values of density near the Uruguayan and Argentinean coast and higher variability in the center of the estuary.
A Student's-t test of significance finds that the summer mean location (Fig. 8.14b) is
- 35
-36
-57
Summer
Fall
Winter
Spring
Longitude
-56
Mean
-57
Summer
Fall
Winter
Spring
Longitude
- 56
Fig. 8.14. Seasonal variability of the turbidity frontal mode and mean loci
The relationships between turbidity maximum and estuarine circulation, physicochemical processes, tidal-stirring, sediment dynamics and stability of the water column have been extensively reviewed in estuarine literature (e.g., Postma 1967;
Schubel 1968; Officer 1976; Allen et al. 1976; Schubel and Carter 1976, 1983; Dyer 1986,
1995; Geyer 1993). Differences in the location of the turbidity maximum are associated with variation in tidal regime, river flow, and sedimentological processes (Allen
et al. 1980; Gelfenbaum 1983; Uncles et al. 1985; Uncles and Stephens 1989). However,
over long-term time scales, the turbidity maximum occurs near the landward limit of
the salt water intrusion (Dyer 1986, 1995; Grabemann and Krause 1989). A relationship
between the frontal location and stability of the water column is then expected. Based
on archived hydrographic data, Framiftan and Brown (1996) com-puted the stratification parameter {~S / h}, where ~s is the bottom-surface salinity difference and h is
the total depth (Plate 8.3d). A good visual correlation exists between the areas of maximum gradient and the areas with maximum frontal density, i.e., the locations of the
salinity intrusion and the satellite-derived loci are in good agreement.
8.6.2
Seasonal Distribution
Framiftan and Brown (1996) also developed monthly, seasonal, and annual analyses
of the frontal density. The seasonal distribution (Plate 8.4) shows that the turbidity
front has its westernmost location during the summer (seasonal composite data sets
are constructed such that: summer is January, February, March; fall is April, May,
June; winter is July, August, September; and spring is October, November, December), when the river discharge is minimum and the predominant winds are southwestward and westward. During spring, the distribution reaches its easternmost location; larger values of frontal density are associated with deeper areas in the central
region and in Samboromb6n Bay. In fall and winter, seasons with maximum river discharge, the distribution is bimodal with maximum values of density near the Uruguayan and Argentinean coast and higher variability in the center of the estuary.
A Student's-t test of significance finds that the summer mean location (Fig. 8.14b) is
- 35
-36
-57
Summer
Fall
Winter
Spring
Longitude
-56
Mean
-57
Summer
Fall
Winter
Spring
Longitude
- 56
Fig. 8.14. Seasonal variability of the turbidity frontal mode and mean loci