

-36
CHAPTER 8 . Physical Characteristics and Processes of the Rio de la Plata Estuary
c
Frontal density (1()-61cJ7r2)
1986-1990
- 56
-55
- 36
-37
d
- 57
-56
Turbidity fronts
1986-1990
-
Frontal density
Mode
-55
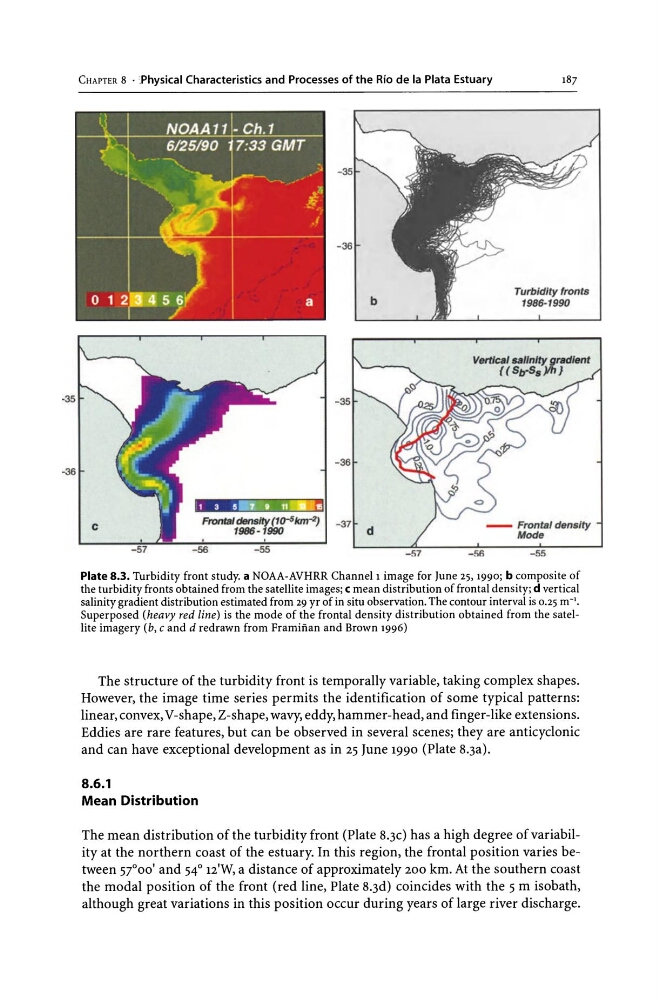
Plate 8.3. Turbidity front study. a NOAA-AVHRR Channell image for June 25, 1990; b composite of
the turbidity fronts obtained from the satellite images; c mean distribution of frontal density; d vertical
salinity gradient distribution estimated from 29 yr of in situ observation. The contour interval is 0.25 m- I •
Superposed (heavy red line) is the mode of the frontal density distribution obtained from the satellite imagery (b, c and d redrawn from Framiftan and Brown 1996)
The structure of the turbidity front is temporally variable, taking complex shapes.
However, the image time series permits the identification of some typical patterns:
linear, convex, V-shape, Z-shape, wavy, eddy, hammer-head, and finger-like extensions.
Eddies are rare features, but can be observed in several scenes; they are anticyclonic
and can have exceptional development as in 25 June 1990 (Plate 8.3a).
8.6.1
Mean Distribution
The mean distribution of the turbidity front (Plate 8.3c) has a high degree of variability at the northern coast of the estuary. In this region, the frontal position varies between 57°00' and 54° 12'W, a distance of approximately 200 km. At the southern coast
the modal position of the front (red line, Plate 8.3d) coincides with the 5 m isobath,
although great variations in this position occur during years of large river discharge.
CHAPTER 8 . Physical Characteristics and Processes of the Rio de la Plata Estuary
c
Frontal density (1()-61cJ7r2)
1986-1990
- 56
-55
- 36
-37
d
- 57
-56
Turbidity fronts
1986-1990
-
Frontal density
Mode
-55
Plate 8.3. Turbidity front study. a NOAA-AVHRR Channell image for June 25, 1990; b composite of
the turbidity fronts obtained from the satellite images; c mean distribution of frontal density; d vertical
salinity gradient distribution estimated from 29 yr of in situ observation. The contour interval is 0.25 m- I •
Superposed (heavy red line) is the mode of the frontal density distribution obtained from the satellite imagery (b, c and d redrawn from Framiftan and Brown 1996)
The structure of the turbidity front is temporally variable, taking complex shapes.
However, the image time series permits the identification of some typical patterns:
linear, convex, V-shape, Z-shape, wavy, eddy, hammer-head, and finger-like extensions.
Eddies are rare features, but can be observed in several scenes; they are anticyclonic
and can have exceptional development as in 25 June 1990 (Plate 8.3a).
8.6.1
Mean Distribution
The mean distribution of the turbidity front (Plate 8.3c) has a high degree of variability at the northern coast of the estuary. In this region, the frontal position varies between 57°00' and 54° 12'W, a distance of approximately 200 km. At the southern coast
the modal position of the front (red line, Plate 8.3d) coincides with the 5 m isobath,
although great variations in this position occur during years of large river discharge.