

CHAPTER 8 . Physical Characteristics and Processes of the Rio de la Plata Estuary
177
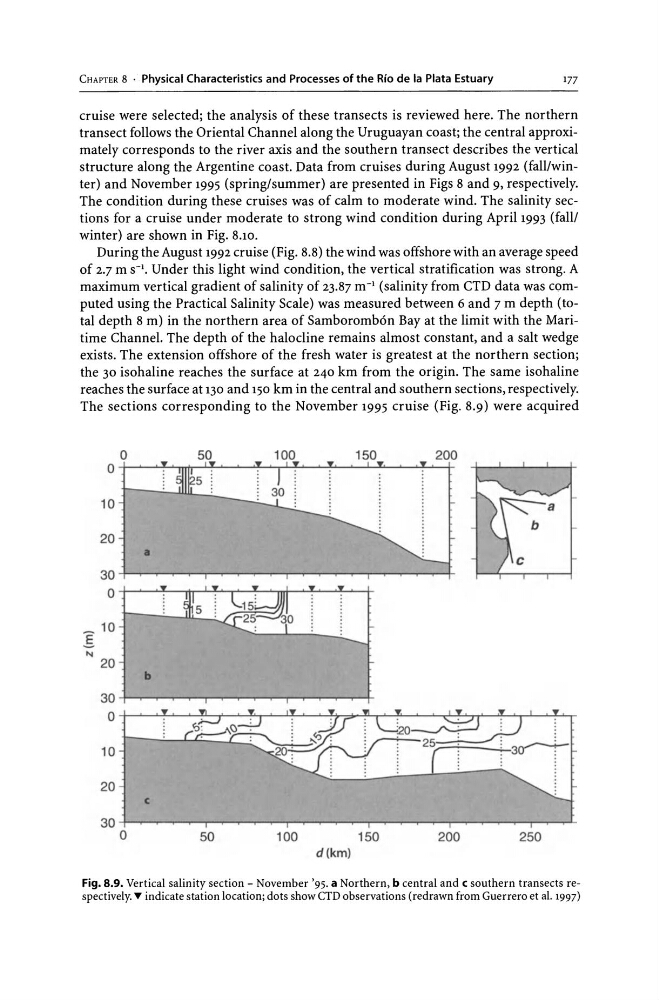
cruise were selected; the analysis of these transects is reviewed here. The northern
transect follows the Oriental Channel along the Uruguayan coast; the central approximately corresponds to the river axis and the southern transect describes the vertical
structure along the Argentine coast. Data from cruises during August 1992 (fall/winter) and November 1995 (spring/summer) are presented in Figs 8 and 9, respectively.
The condition during these cruises was of calm to moderate wind. The salinity sections for a cruise under moderate to strong wind condition during April 1993 (fall/
winter) are shown in Fig. 8.10.
During the August 1992 cruise (Fig. 8.8) the wind was offshore with an average speed
of 2.7 m S-I. Under this light wind condition, the vertical stratification was strong. A
maximum vertical gradient of salinity of 23.87 m- I (salinity from CTD data was computed using the Practical Salinity Scale) was measured between 6 and 7 m depth (total depth 8 m) in the northern area of Samboromb6n Bay at the limit with the Maritime Channel. The depth of the halo cline remains almost constant, and a salt wedge
exists. The extension offshore of the fresh water is greatest at the northern section;
the 30 isohaline reaches the surface at 240 km from the origin. The same isohaline
reaches the surface at 130 and 150 km in the central and southern sections, respectively.
The sections corresponding to the November 1995 cruise (Fig. 8.9) were acquired
o
o+-~~~~~~~~~~~~~~~~~+
50
100
150
200
10
20
•
30+-~~~~~~~~~~~~~~~~~+
O+-~~~~~~~~~~~~-+
_ 10
E
' " 20
b
30+-~~~~~~~~~~~~+
O+-~~~~-r~~~~~~~~~~~~~~~~~~~
10
20
c
d(km)
Fig. 8.9. Vertical salinity section - November '95. a Northern, b central and c southern transects respectively. " indicate station location; dots show CTD observations (redrawn from Guerrero et al. 1997)
177
cruise were selected; the analysis of these transects is reviewed here. The northern
transect follows the Oriental Channel along the Uruguayan coast; the central approximately corresponds to the river axis and the southern transect describes the vertical
structure along the Argentine coast. Data from cruises during August 1992 (fall/winter) and November 1995 (spring/summer) are presented in Figs 8 and 9, respectively.
The condition during these cruises was of calm to moderate wind. The salinity sections for a cruise under moderate to strong wind condition during April 1993 (fall/
winter) are shown in Fig. 8.10.
During the August 1992 cruise (Fig. 8.8) the wind was offshore with an average speed
of 2.7 m S-I. Under this light wind condition, the vertical stratification was strong. A
maximum vertical gradient of salinity of 23.87 m- I (salinity from CTD data was computed using the Practical Salinity Scale) was measured between 6 and 7 m depth (total depth 8 m) in the northern area of Samboromb6n Bay at the limit with the Maritime Channel. The depth of the halo cline remains almost constant, and a salt wedge
exists. The extension offshore of the fresh water is greatest at the northern section;
the 30 isohaline reaches the surface at 240 km from the origin. The same isohaline
reaches the surface at 130 and 150 km in the central and southern sections, respectively.
The sections corresponding to the November 1995 cruise (Fig. 8.9) were acquired
o
o+-~~~~~~~~~~~~~~~~~+
50
100
150
200
10
20
•
30+-~~~~~~~~~~~~~~~~~+
O+-~~~~~~~~~~~~-+
_ 10
E
' " 20
b
30+-~~~~~~~~~~~~+
O+-~~~~-r~~~~~~~~~~~~~~~~~~~
10
20
c
d(km)
Fig. 8.9. Vertical salinity section - November '95. a Northern, b central and c southern transects respectively. " indicate station location; dots show CTD observations (redrawn from Guerrero et al. 1997)