

178
M.B. Framiftan . M.P. Etala . E.M. Acha . R. A. Guerrero . C.A. Lasta . O.B. Brown
o
O+-~~~~~~~~~~~~~~~~~+
50
100
150
200
10
20
30+-~~~~~~~~~~~~~~~~~~
O+-~~~~~~~~~~~~~~~~~~~~~~~~
10
20
30+-~~~~~~~~~~~~~~--~~~~--~~~~
O+-~~~~~~~~~-L~~~~~.r~~~~
5
10
20
c
o
50
100
150
200
d(km)
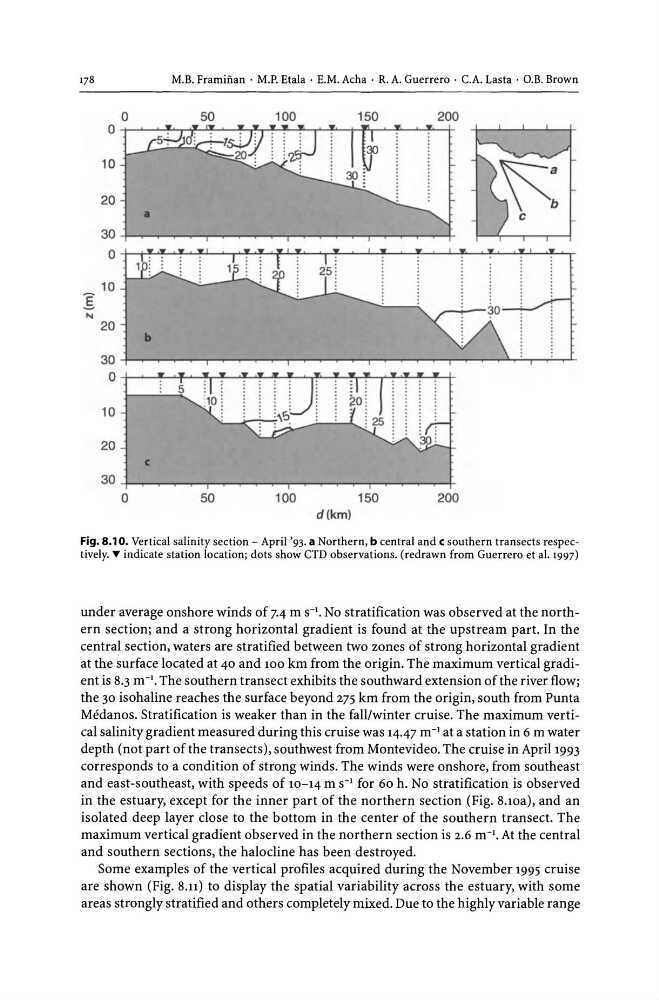
Fig. 8.10. Vertical salinity section - April '93. a Northern, b central and c southern transects respectively. T indicate station location; dots show crD observations. (redrawn from Guerrero et al. 1997)
under average onshore winds of 7.4 m S-I. No stratification was observed at the northern section; and a strong horizontal gradient is found at the upstream part. In the
central section, waters are stratified between two zones of strong horizontal gradient
at the surface located at 40 and 100 km from the origin. The maximum vertical gradient is 8.3 m- I • The southern transect exhibits the southward extension of the river flow;
the 30 isohaline reaches the surface beyond 275 km from the origin, south from Punta
Medanos. Stratification is weaker than in the fall/winter cruise. The maximum vertical salinity gradient measured during this cruise was 14.47 m- I at a station in 6 m water
depth (not part of the transects), southwest from Montevideo. The cruise in April 1993
corresponds to a condition of strong winds. The winds were onshore, from southeast
and east-southeast, with speeds of 10-14 m S-I for 60 h. No stratification is observed
in the estuary, except for the inner part of the northern section (Fig. 8.lOa), and an
isolated deep layer close to the bottom in the center of the southern transect. The
maximum vertical gradient observed in the northern section is 2.6 m- I • At the central
and southern sections, the halocline has been destroyed.
Some examples of the vertical profiles acquired during the November 1995 cruise
are shown (Fig. 8.n) to display the spatial variability across the estuary, with some
areas strongly stratified and others completely mixed. Due to the highly variable range
M.B. Framiftan . M.P. Etala . E.M. Acha . R. A. Guerrero . C.A. Lasta . O.B. Brown
o
O+-~~~~~~~~~~~~~~~~~+
50
100
150
200
10
20
30+-~~~~~~~~~~~~~~~~~~
O+-~~~~~~~~~~~~~~~~~~~~~~~~
10
20
30+-~~~~~~~~~~~~~~--~~~~--~~~~
O+-~~~~~~~~~-L~~~~~.r~~~~
5
10
20
c
o
50
100
150
200
d(km)
Fig. 8.10. Vertical salinity section - April '93. a Northern, b central and c southern transects respectively. T indicate station location; dots show crD observations. (redrawn from Guerrero et al. 1997)
under average onshore winds of 7.4 m S-I. No stratification was observed at the northern section; and a strong horizontal gradient is found at the upstream part. In the
central section, waters are stratified between two zones of strong horizontal gradient
at the surface located at 40 and 100 km from the origin. The maximum vertical gradient is 8.3 m- I • The southern transect exhibits the southward extension of the river flow;
the 30 isohaline reaches the surface beyond 275 km from the origin, south from Punta
Medanos. Stratification is weaker than in the fall/winter cruise. The maximum vertical salinity gradient measured during this cruise was 14.47 m- I at a station in 6 m water
depth (not part of the transects), southwest from Montevideo. The cruise in April 1993
corresponds to a condition of strong winds. The winds were onshore, from southeast
and east-southeast, with speeds of 10-14 m S-I for 60 h. No stratification is observed
in the estuary, except for the inner part of the northern section (Fig. 8.lOa), and an
isolated deep layer close to the bottom in the center of the southern transect. The
maximum vertical gradient observed in the northern section is 2.6 m- I • At the central
and southern sections, the halocline has been destroyed.
Some examples of the vertical profiles acquired during the November 1995 cruise
are shown (Fig. 8.n) to display the spatial variability across the estuary, with some
areas strongly stratified and others completely mixed. Due to the highly variable range