

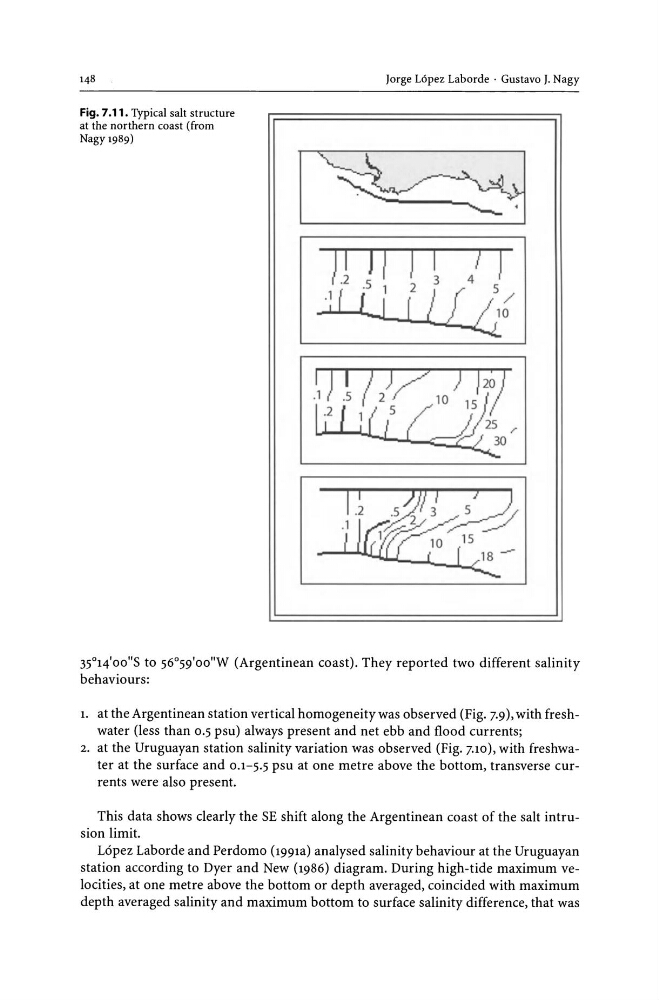
Fig. 7.11. Typical salt structure
at the northern coast (from
Nagy 1989)
Jorge Lopez Laborde . Gustavo J. Nagy
I~
I I
! .2
· u
J I ) I /)
.s 1 2 3
4
LJ [/Lil
35°14'00"S to 56°59'00"W (Argentinean coast). They reported two different salinity
behaviours:
1. at the Argentinean station vertical homogeneity was observed (Fig. 7.9), with freshwater (less than 0.5 psu) always present and net ebb and flood currents;
2. at the Uruguayan station salinity variation was observed (Fig. 7.10), with freshwater at the surface and 0.1-5.5 psu at one metre above the bottom, transverse currents were also present.
This data shows dearly the SE shift along the Argentinean coast of the salt intrusion limit.
Lopez Laborde and Perdomo (1991a) analysed salinity behaviour at the Uruguayan
station according to Dyer and New (1986) diagram. During high-tide maximum velocities, at one metre above the bottom or depth averaged, coincided with maximum
depth averaged salinity and maximum bottom to surface salinity difference, that was
at the northern coast (from
Nagy 1989)
Jorge Lopez Laborde . Gustavo J. Nagy
I~
I I
! .2
· u
J I ) I /)
.s 1 2 3
4
LJ [/Lil
35°14'00"S to 56°59'00"W (Argentinean coast). They reported two different salinity
behaviours:
1. at the Argentinean station vertical homogeneity was observed (Fig. 7.9), with freshwater (less than 0.5 psu) always present and net ebb and flood currents;
2. at the Uruguayan station salinity variation was observed (Fig. 7.10), with freshwater at the surface and 0.1-5.5 psu at one metre above the bottom, transverse currents were also present.
This data shows dearly the SE shift along the Argentinean coast of the salt intrusion limit.
Lopez Laborde and Perdomo (1991a) analysed salinity behaviour at the Uruguayan
station according to Dyer and New (1986) diagram. During high-tide maximum velocities, at one metre above the bottom or depth averaged, coincided with maximum
depth averaged salinity and maximum bottom to surface salinity difference, that was