

CHAPTER 7 • Hydrography and Sediment Transport Characteristics of the Rio de la Plata
147
40
35
150
30
~
~
25
125 0
.9.
. .
20
"
E
.:;
100 ..
.. 15
E
c:
0
0
010
::.;:
E
10
8 5
~
. .
. ~
"
v
0
;::
0
a; ·5
>
;;;
c:
'5
· 10
3 ·1 5
'0.
c: ·20
~
·25
·30
350
6
-
Salinity
-
Suspended sediment
300
-250
c!...
v'"
1
.§ E
4
200 ,,- .. c
Eo
~ 0
~
150
'0 't::
. . '"
:~
-oz c c:
;;;
100 ....
'"
Q. V
~ c:
50
:> 0
'" u
0
0
1 3 5 7 9 11 13 15 17 19 21 23 25 27 29 3133 35 37
Sampling hours
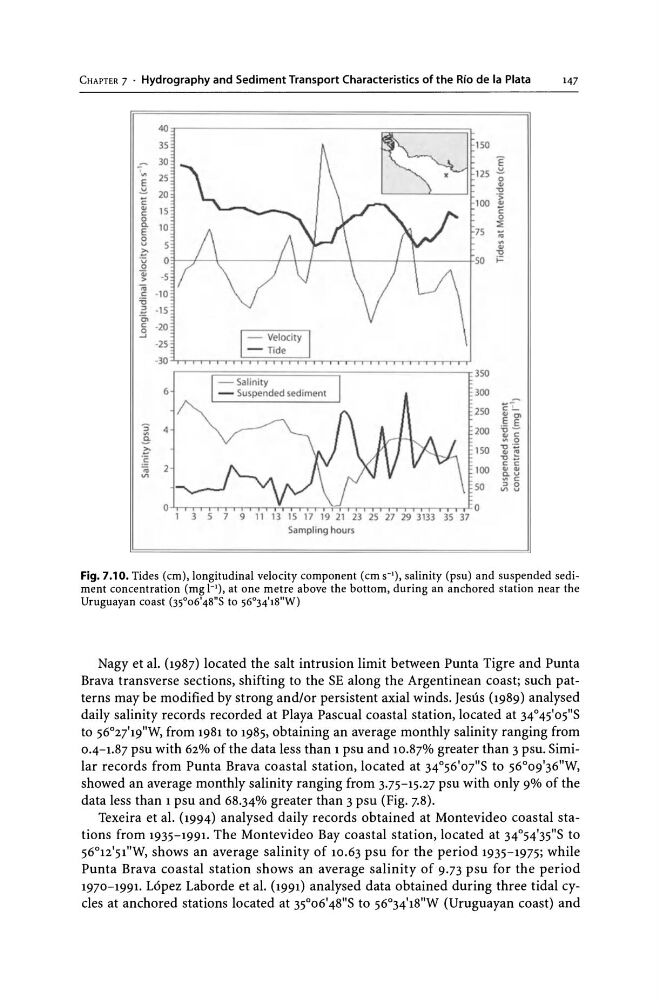
Fig. 7.10. Tides (em), longitudinal velocity component (em S-I), salinity (psu) and suspended sediment concentration (mg 1-1), at one metre above the bottom, during an anchored station near the
Uruguayan coast (35°06'48"5 to 56°34'18"W)
Nagy et al. (1987) located the salt intrusion limit between Punta Tigre and Punta
Brava transverse sections, shifting to the SE along the Argentinean coast; such patterns may be modified by strong and/or persistent axial winds. Jesus (1989) analysed
daily salinity records recorded at Playa Pascual coastal station, located at 34° 45'05"S
to 56°27"19"W, from 1981 to 1985, obtaining an average monthly salinity ranging from
0.4-1.87 psu with 62% of the data less than 1 psu and 1O.8iYo greater than 3 psu. Similar records from Punta Brava coastal station, located at 34°56'07"'S to 56°09'36"W,
showed an average monthly salinity ranging from 3.75-15.27 psu with only 9% of the
data less than 1 psu and 68.34% greater than 3 psu (Fig. 7.8).
Texeira et al. (1994) analysed daily records obtained at Montevideo coastal stations from 1935-1991. The Montevideo Bay coastal station, located at 34°54'35"S to
S6°12'51"W, shows an average salinity of 10.63 psu for the period 1935-1975; while
Punta Brava coastal station shows an average salinity of 9.73 psu for the period
1970-1991. Lopez Laborde et al. (1991) analysed data obtained during three tidal cycles at anchored stations located at 35°06'48"S to S6°34'18"W (Uruguayan coast) and
147
40
35
150
30
~
~
25
125 0
.9.
. .
20
"
E
.:;
100 ..
.. 15
E
c:
0
0
010
::.;:
E
10
8 5
~
. .
. ~
"
v
0
;::
0
a; ·5
>
;;;
c:
'5
· 10
3 ·1 5
'0.
c: ·20
~
·25
·30
350
6
-
Salinity
-
Suspended sediment
300
-250
c!...
v'"
1
.§ E
4
200 ,,- .. c
Eo
~ 0
~
150
'0 't::
. . '"
:~
-oz c c:
;;;
100 ....
'"
Q. V
~ c:
50
:> 0
'" u
0
0
1 3 5 7 9 11 13 15 17 19 21 23 25 27 29 3133 35 37
Sampling hours
Fig. 7.10. Tides (em), longitudinal velocity component (em S-I), salinity (psu) and suspended sediment concentration (mg 1-1), at one metre above the bottom, during an anchored station near the
Uruguayan coast (35°06'48"5 to 56°34'18"W)
Nagy et al. (1987) located the salt intrusion limit between Punta Tigre and Punta
Brava transverse sections, shifting to the SE along the Argentinean coast; such patterns may be modified by strong and/or persistent axial winds. Jesus (1989) analysed
daily salinity records recorded at Playa Pascual coastal station, located at 34° 45'05"S
to 56°27"19"W, from 1981 to 1985, obtaining an average monthly salinity ranging from
0.4-1.87 psu with 62% of the data less than 1 psu and 1O.8iYo greater than 3 psu. Similar records from Punta Brava coastal station, located at 34°56'07"'S to 56°09'36"W,
showed an average monthly salinity ranging from 3.75-15.27 psu with only 9% of the
data less than 1 psu and 68.34% greater than 3 psu (Fig. 7.8).
Texeira et al. (1994) analysed daily records obtained at Montevideo coastal stations from 1935-1991. The Montevideo Bay coastal station, located at 34°54'35"S to
S6°12'51"W, shows an average salinity of 10.63 psu for the period 1935-1975; while
Punta Brava coastal station shows an average salinity of 9.73 psu for the period
1970-1991. Lopez Laborde et al. (1991) analysed data obtained during three tidal cycles at anchored stations located at 35°06'48"S to S6°34'18"W (Uruguayan coast) and