

CHAPTER 7 • Hydrography and Sediment Transport Characteristics of the Rio de la Plata
149
5r
56·
55·
35·
limit
Salinity (psu)
20
500
~ 15
400
.3
300 ~
.~1O
z
c
200
"jij
III
5
100
0
0
5
10
15
Station
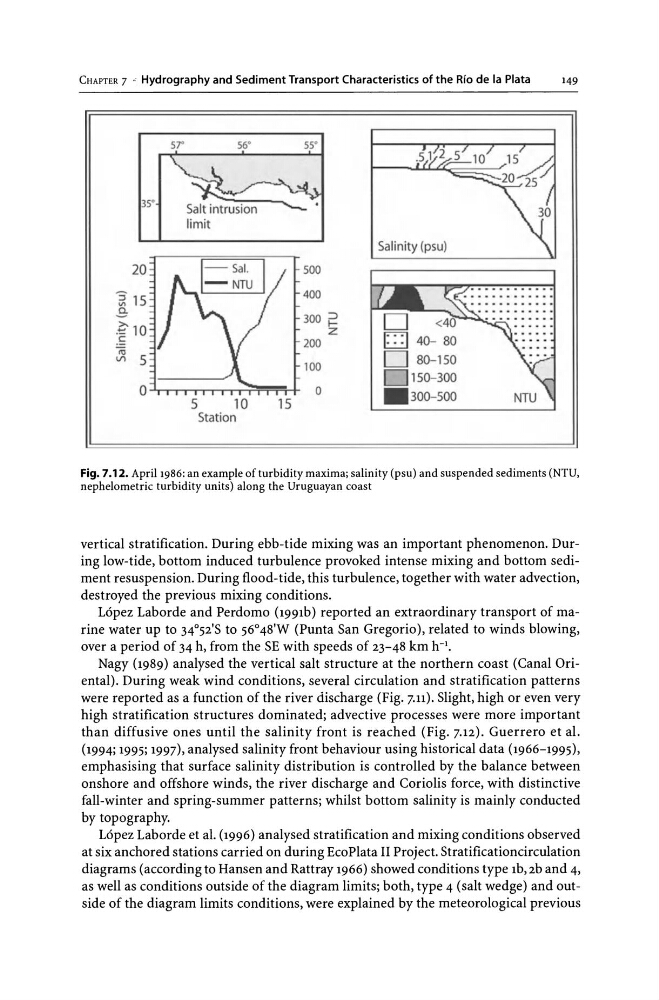
Fig. 7.12. April 1986: an example of turbidity maxima; salinity (psu) and suspended sediments (NTU,
nephelometric turbidity units) along the Uruguayan coast
vertical stratification. During ebb-tide mixing was an important phenomenon. During low-tide, bottom induced turbulence provoked intense mixing and bottom sediment resuspension. During flood-tide, this turbulence, together with water advection,
destroyed the previous mixing conditions.
Lopez Laborde and Perdomo (1991b) reported an extraordinary transport of marine water up to 34°52'S to 56° 48'W (Punta San Gregorio), related to winds blowing,
over a period of 34 h, from the SE with speeds of 23-48 km h- 1 •
Nagy (1989) analysed the vertical salt structure at the northern coast (Canal Oriental). During weak wind conditions, several circulation and stratification patterns
were reported as a function of the river discharge (Fig. 7.11). Slight, high or even very
high stratification structures dominated; advective processes were more important
than diffusive ones until the salinity front is reached (Fig. 7.l2). Guerrero et al.
(1994; 1995; 1997), analysed salinity front behaviour using historical data (1966-1995),
emphasising that surface salinity distribution is controlled by the balance between
onshore and offshore winds, the river discharge and Coriolis force, with distinctive
fall-winter and spring-summer patterns; whilst bottom salinity is mainly conducted
by topography.
Lopez Laborde et al. (1996) analysed stratification and mixing conditions observed
at six anchored stations carried on during EcoPlata II Project. Stratificationcirculation
diagrams (according to Hansen and Rattray 1966) showed conditions type 1b,2b and 4,
as well as conditions outside of the diagram limits; both, type 4 (salt wedge) and outside of the diagram limits conditions, were explained by the meteorological previous
149
5r
56·
55·
35·
limit
Salinity (psu)
20
500
~ 15
400
.3
300 ~
.~1O
z
c
200
"jij
III
5
100
0
0
5
10
15
Station
Fig. 7.12. April 1986: an example of turbidity maxima; salinity (psu) and suspended sediments (NTU,
nephelometric turbidity units) along the Uruguayan coast
vertical stratification. During ebb-tide mixing was an important phenomenon. During low-tide, bottom induced turbulence provoked intense mixing and bottom sediment resuspension. During flood-tide, this turbulence, together with water advection,
destroyed the previous mixing conditions.
Lopez Laborde and Perdomo (1991b) reported an extraordinary transport of marine water up to 34°52'S to 56° 48'W (Punta San Gregorio), related to winds blowing,
over a period of 34 h, from the SE with speeds of 23-48 km h- 1 •
Nagy (1989) analysed the vertical salt structure at the northern coast (Canal Oriental). During weak wind conditions, several circulation and stratification patterns
were reported as a function of the river discharge (Fig. 7.11). Slight, high or even very
high stratification structures dominated; advective processes were more important
than diffusive ones until the salinity front is reached (Fig. 7.l2). Guerrero et al.
(1994; 1995; 1997), analysed salinity front behaviour using historical data (1966-1995),
emphasising that surface salinity distribution is controlled by the balance between
onshore and offshore winds, the river discharge and Coriolis force, with distinctive
fall-winter and spring-summer patterns; whilst bottom salinity is mainly conducted
by topography.
Lopez Laborde et al. (1996) analysed stratification and mixing conditions observed
at six anchored stations carried on during EcoPlata II Project. Stratificationcirculation
diagrams (according to Hansen and Rattray 1966) showed conditions type 1b,2b and 4,
as well as conditions outside of the diagram limits; both, type 4 (salt wedge) and outside of the diagram limits conditions, were explained by the meteorological previous