

88
Osmar O. Moller Jr .. Patrice Castaing
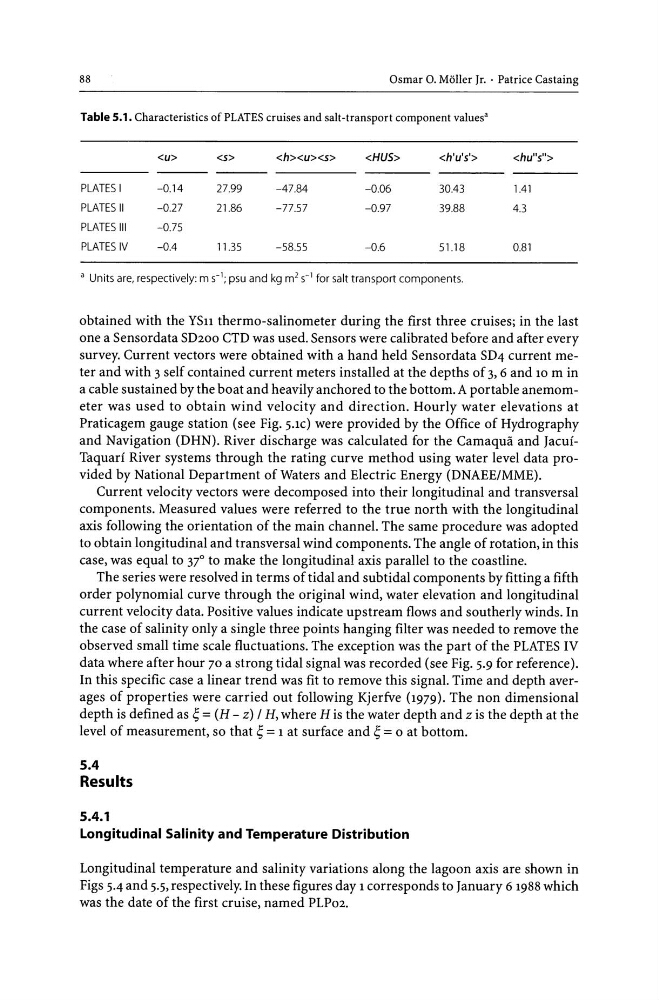
Table 5.1. Characteristics of PLATES cruises and salt-transport component values'
PLATES I
-0.14
27.99
-47.84
-0.06
30.43
1.41
PLATES II
-0.27
21.86
-77.57
-0.97
39.88
4.3
PLATES III
-0.75
PLATES IV
-0.4
11.35
-58.55
-0.6
51.18
0.81
a Units are, respectively: m S-1; psu and kg m 2 S-1 for salt transport components.
obtained with the YSn thermo-salinometer during the first three cruises; in the last
one a Sensordata SD200 CTD was used. Sensors were calibrated before and after every
survey. Current vectors were obtained with a hand held Sensordata SD4 current meter and with 3 self contained current meters installed at the depths of 3, 6 and 10 m in
a cable sustained by the boat and heavily anchored to the bottom. A portable anemometer was used to obtain wind velocity and direction. Hourly water elevations at
Praticagem gauge station (see Fig. 5.1C) were provided by the Office of Hydrography
and Navigation (DHN). River discharge was calculated for the Camaqua and JacuiTaquari River systems through the rating curve method using water level data provided by National Department of Waters and Electric Energy (DNAEE/MME).
Current velocity vectors were decomposed into their longitudinal and transversal
components. Measured values were referred to the true north with the longitudinal
axis following the orientation of the main channel. The same procedure was adopted
to obtain longitudinal and transversal wind components. The angle of rotation, in this
case, was equal to 37° to make the longitudinal axis parallel to the coastline.
The series were resolved in terms of tidal and subtidal components by fitting a fifth
order polynomial curve through the original wind, water elevation and longitudinal
current velocity data. Positive values indicate upstream flows and southerly winds. In
the case of salinity only a single three points hanging filter was needed to remove the
observed small time scale fluctuations. The exception was the part of the PLATES IV
data where after hour 70 a strong tidal signal was recorded (see Fig. 5.9 for reference).
In this specific case a linear trend was fit to remove this signal. Time and depth averages of properties were carried out following Kjerfve (1979). The non dimensional
depth is defined as ~ = (H - z) I H, where H is the water depth and z is the depth at the
level of measurement, so that ~ = 1 at surface and ~ = 0 at bottom.
5.4
Results
5.4.1
Longitudinal Salinity and Temperature Distribution
Longitudinal temperature and salinity variations along the lagoon axis are shown in
Figs 5.4 and 5.5, respectively. In these figures day 1 corresponds to January 61988 which
was the date of the first cruise, named PLP02.
Osmar O. Moller Jr .. Patrice Castaing
Table 5.1. Characteristics of PLATES cruises and salt-transport component values'
PLATES I
-0.14
27.99
-47.84
-0.06
30.43
1.41
PLATES II
-0.27
21.86
-77.57
-0.97
39.88
4.3
PLATES III
-0.75
PLATES IV
-0.4
11.35
-58.55
-0.6
51.18
0.81
a Units are, respectively: m S-1; psu and kg m 2 S-1 for salt transport components.
obtained with the YSn thermo-salinometer during the first three cruises; in the last
one a Sensordata SD200 CTD was used. Sensors were calibrated before and after every
survey. Current vectors were obtained with a hand held Sensordata SD4 current meter and with 3 self contained current meters installed at the depths of 3, 6 and 10 m in
a cable sustained by the boat and heavily anchored to the bottom. A portable anemometer was used to obtain wind velocity and direction. Hourly water elevations at
Praticagem gauge station (see Fig. 5.1C) were provided by the Office of Hydrography
and Navigation (DHN). River discharge was calculated for the Camaqua and JacuiTaquari River systems through the rating curve method using water level data provided by National Department of Waters and Electric Energy (DNAEE/MME).
Current velocity vectors were decomposed into their longitudinal and transversal
components. Measured values were referred to the true north with the longitudinal
axis following the orientation of the main channel. The same procedure was adopted
to obtain longitudinal and transversal wind components. The angle of rotation, in this
case, was equal to 37° to make the longitudinal axis parallel to the coastline.
The series were resolved in terms of tidal and subtidal components by fitting a fifth
order polynomial curve through the original wind, water elevation and longitudinal
current velocity data. Positive values indicate upstream flows and southerly winds. In
the case of salinity only a single three points hanging filter was needed to remove the
observed small time scale fluctuations. The exception was the part of the PLATES IV
data where after hour 70 a strong tidal signal was recorded (see Fig. 5.9 for reference).
In this specific case a linear trend was fit to remove this signal. Time and depth averages of properties were carried out following Kjerfve (1979). The non dimensional
depth is defined as ~ = (H - z) I H, where H is the water depth and z is the depth at the
level of measurement, so that ~ = 1 at surface and ~ = 0 at bottom.
5.4
Results
5.4.1
Longitudinal Salinity and Temperature Distribution
Longitudinal temperature and salinity variations along the lagoon axis are shown in
Figs 5.4 and 5.5, respectively. In these figures day 1 corresponds to January 61988 which
was the date of the first cruise, named PLP02.