

CHAPTER 5 . Hydrographical Characteristics of the Estuarine Area of Patos Lagoon
10
a
02
03
04
OS 06
07
08 09
10 11
12
- 10 t---~---+--~--~~--+---~---+---+--~~--+---4---~
8000
'on 7000
1. 6000
'" 5000
~ 4000
.s:.
:.< 3000
'0 2000
~
a: 1000
30
60
90
120 150
180
210
240
270
300 330 360
02
03
04
OS 06
07
08 09
10 11
12
0 t---~~~~-+---+---+--~---1~~~--~--+---+-~
30
60
90
120 1 SO
180
210
240
270
300 330 360
Time (Julian days)
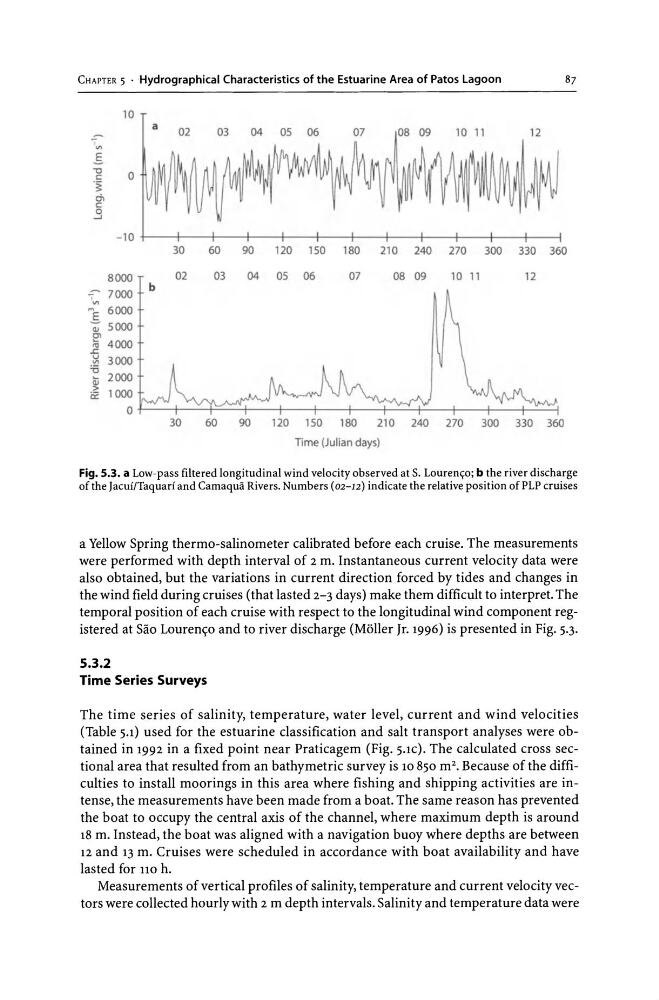
Fig. 5.3. a Low-pass filtered longitudinal wind velocity observed at S. Louren<;o; b the river discharge
of the jacuilTaquari and Camaqua Rivers. Numbers (02-12) indicate the relative position of PLP cruises
a Yellow Spring thermo-salinometer calibrated before each cruise. The measurements
were performed with depth interval of 2 m. Instantaneous current velocity data were
also obtained, but the variations in current direction forced by tides and changes in
the wind field during cruises (that lasted 2-3 days) make them difficult to interpret. The
temporal position of each cruise with respect to the longitudinal wind component registered at Sao Louren
Time Series Surveys
The time series of salinity, temperature, water level, current and wind velocities
(Table 5.1) used for the estuarine classification and salt transport analyses were obtained in 1992 in a fixed point near Praticagem (Fig. 5.1C). The calculated cross sectional area that resulted from an bathymetric survey is 10 850 m 2 • Because of the difficulties to install moorings in this area where fishing and shipping activities are intense, the measurements have been made from a boat. The same reason has prevented
the boat to occupy the central axis of the channel, where maximum depth is around
18 m. Instead, the boat was aligned with a navigation buoy where depths are between
12 and 13 m. Cruises were scheduled in accordance with boat availability and have
lasted for 110 h.
Measurements of vertical profiles of salinity, temperature and current velocity vectors were collected hourly with 2 m depth intervals. Salinity and temperature data were
10
a
02
03
04
OS 06
07
08 09
10 11
12
- 10 t---~---+--~--~~--+---~---+---+--~~--+---4---~
8000
'on 7000
1. 6000
'" 5000
~ 4000
.s:.
:.< 3000
'0 2000
~
a: 1000
30
60
90
120 150
180
210
240
270
300 330 360
02
03
04
OS 06
07
08 09
10 11
12
0 t---~~~~-+---+---+--~---1~~~--~--+---+-~
30
60
90
120 1 SO
180
210
240
270
300 330 360
Time (Julian days)
Fig. 5.3. a Low-pass filtered longitudinal wind velocity observed at S. Louren<;o; b the river discharge
of the jacuilTaquari and Camaqua Rivers. Numbers (02-12) indicate the relative position of PLP cruises
a Yellow Spring thermo-salinometer calibrated before each cruise. The measurements
were performed with depth interval of 2 m. Instantaneous current velocity data were
also obtained, but the variations in current direction forced by tides and changes in
the wind field during cruises (that lasted 2-3 days) make them difficult to interpret. The
temporal position of each cruise with respect to the longitudinal wind component registered at Sao Louren
Time Series Surveys
The time series of salinity, temperature, water level, current and wind velocities
(Table 5.1) used for the estuarine classification and salt transport analyses were obtained in 1992 in a fixed point near Praticagem (Fig. 5.1C). The calculated cross sectional area that resulted from an bathymetric survey is 10 850 m 2 • Because of the difficulties to install moorings in this area where fishing and shipping activities are intense, the measurements have been made from a boat. The same reason has prevented
the boat to occupy the central axis of the channel, where maximum depth is around
18 m. Instead, the boat was aligned with a navigation buoy where depths are between
12 and 13 m. Cruises were scheduled in accordance with boat availability and have
lasted for 110 h.
Measurements of vertical profiles of salinity, temperature and current velocity vectors were collected hourly with 2 m depth intervals. Salinity and temperature data were