

2.8 Other Analytical Properties
83
60
SO
40
~ 30
c
20
.2
,~
10
'" >
0
0
c: -10
==
0
u
-40
-50
-60
10% 1 % 0.01%
1 119/ml
1 119/ml
ConcenJration
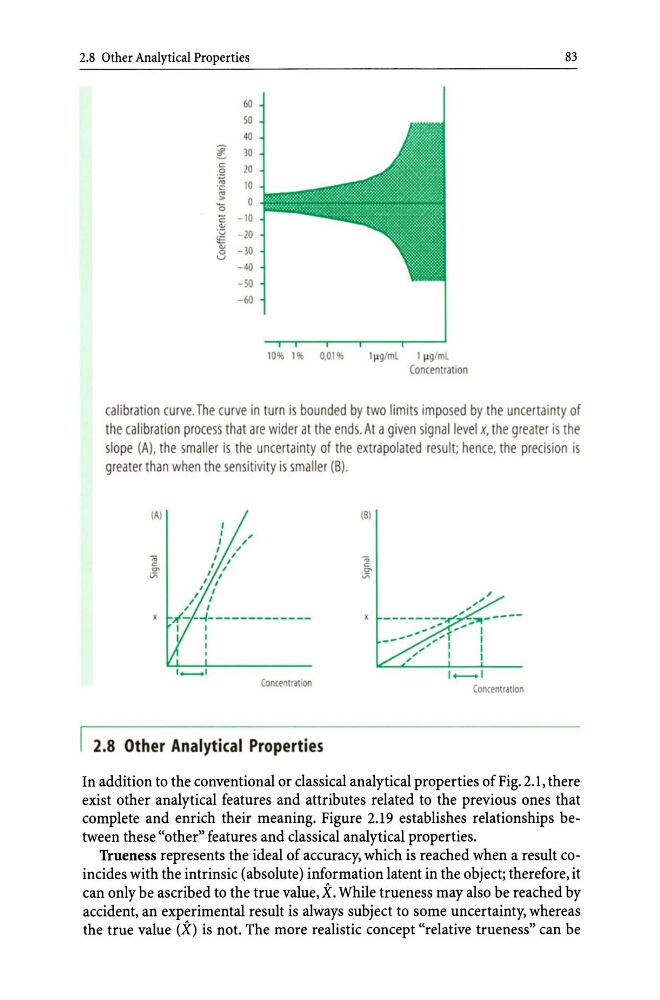
calibration curve. The curve in turn is bounded by two limits imposed by the uncertainty of
the calibration process that are wider at the ends. At a given signal level x, the greater is the
slope (A), the smaller is the uncertainty of the extrapolated result; hence, the preCision is
greater than when the sensitivity is smaller (B)
IA)
. .
c
'"
Vi
,
,
,
I
;
I
I
I
I
I
I
,
I
I
I
,
I
,
I
I
,
X ,(- ~ ____________ _
I
I
Concentlallon
2.8 Other Analytical Properties
18)
;
","
x _______ ,_~" ....... _---",,"
,'- I
__ -' " . . . . f
I
,,'
I
I
,,"
I
I
1 .......... 1
Concentrauon
In addition to the conventional or classical analytical properties of Fig. 2.1, there
exist other analytical features and attributes related to the previous ones that
complete and enrich their meaning. Figure 2.19 establishes relationships between these "other" features and classical analytical properties.
Trueness represents the ideal of accuracy, which is reached when a result coincides with the intrinsic (absolute) information latent in the object; therefore, it
can only be ascribed to the true value, X. While trueness may also be reached by
accident, an experimental result is always subject to some uncertainty, whereas
the true value (X) is not. The more realistic concept "relative trueness" can be
83
60
SO
40
~ 30
c
20
.2
,~
10
'" >
0
0
c: -10
==
0
u
-40
-50
-60
10% 1 % 0.01%
1 119/ml
1 119/ml
ConcenJration
calibration curve. The curve in turn is bounded by two limits imposed by the uncertainty of
the calibration process that are wider at the ends. At a given signal level x, the greater is the
slope (A), the smaller is the uncertainty of the extrapolated result; hence, the preCision is
greater than when the sensitivity is smaller (B)
IA)
. .
c
'"
Vi
,
,
,
I
;
I
I
I
I
I
I
,
I
I
I
,
I
,
I
I
,
X ,(- ~ ____________ _
I
I
Concentlallon
2.8 Other Analytical Properties
18)
;
","
x _______ ,_~" ....... _---",,"
,'- I
__ -' " . . . . f
I
,,'
I
I
,,"
I
I
1 .......... 1
Concentrauon
In addition to the conventional or classical analytical properties of Fig. 2.1, there
exist other analytical features and attributes related to the previous ones that
complete and enrich their meaning. Figure 2.19 establishes relationships between these "other" features and classical analytical properties.
Trueness represents the ideal of accuracy, which is reached when a result coincides with the intrinsic (absolute) information latent in the object; therefore, it
can only be ascribed to the true value, X. While trueness may also be reached by
accident, an experimental result is always subject to some uncertainty, whereas
the true value (X) is not. The more realistic concept "relative trueness" can be