

82
2 Analytical Properties
Box 2.15
The purpose of this example is to establish a specific relationship between a basic (precision)
and two accessory analytical properties (expeditiousness and cost-effectiveness), in addition
to one between the latter two.
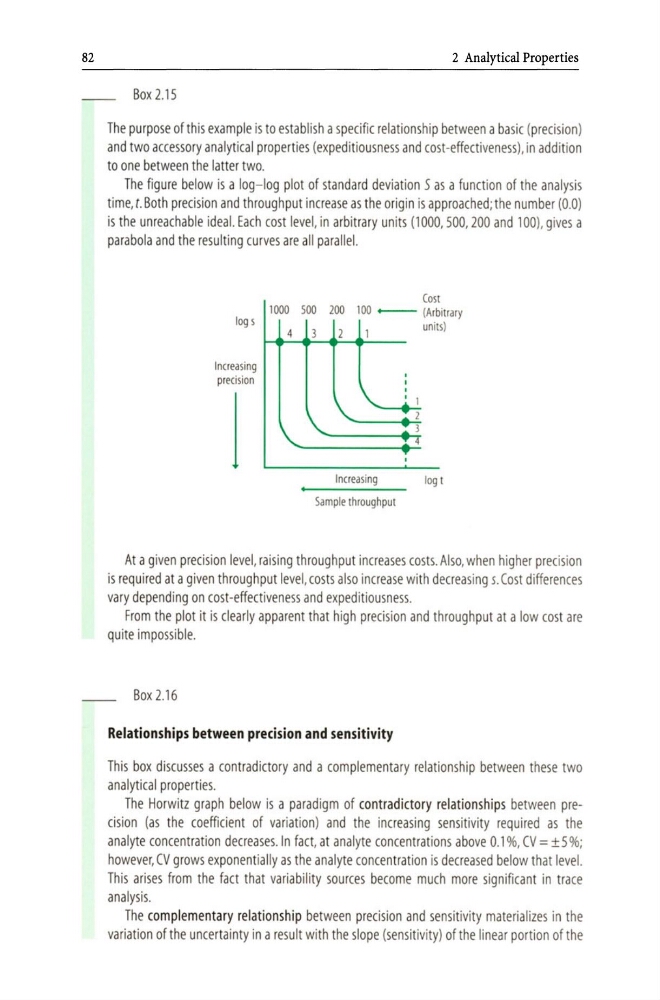
The figure below is a log- log plot of standard deviation 5 as a function of the analysis
time, c. Both precision and throughput increase as the origin is approached; the number (0.0)
is the unreachable ideal. Each cost level, in arbitrary units (1000,500,200 and 100). gives a
parabola and the resu lting curves are all parallel.
log s
Increasing
precision
j
Cost
1000 500 200 100 -
(Arbitrary
4
3
Increasing
Sample throughput
I
":" 1
...... 2
.... J
4
units)
log t
At a given precision level, raising throughput increases costs. Also, when higher precision
is required at a given throughput level, costs also increase with decreasing s. Cost differences
vary depending on cost-effectiveness and expeditiousness.
From the plot it is clearly apparent that high precision and throughput at a low cost are
quite impossible.
__ Box 2.16
Relationships between precision and sensitivity
This box discusses a contradictory and a com plementary relationship between these two
analytical properties.
The Horwitz graph below is a paradigm of contradictory relationships between precision (as the coefficient of variation) and the increasing sensitivity required as the
analyte concentration decreases. In fact, at analyte concentrations above 0.1 %, CV = ± 5 %;
however, CV grows exponentially as the analyte concentration is decreased below that level.
This arises from the fact that variability sources become much more significant in trace
analysis.
The compl ementary relationship between precision and sensitivity materializes in the
variation of the uncertainty in a result with the slope (sensitivity) of the linear portion of the
2 Analytical Properties
Box 2.15
The purpose of this example is to establish a specific relationship between a basic (precision)
and two accessory analytical properties (expeditiousness and cost-effectiveness), in addition
to one between the latter two.
The figure below is a log- log plot of standard deviation 5 as a function of the analysis
time, c. Both precision and throughput increase as the origin is approached; the number (0.0)
is the unreachable ideal. Each cost level, in arbitrary units (1000,500,200 and 100). gives a
parabola and the resu lting curves are all parallel.
log s
Increasing
precision
j
Cost
1000 500 200 100 -
(Arbitrary
4
3
Increasing
Sample throughput
I
":" 1
...... 2
.... J
4
units)
log t
At a given precision level, raising throughput increases costs. Also, when higher precision
is required at a given throughput level, costs also increase with decreasing s. Cost differences
vary depending on cost-effectiveness and expeditiousness.
From the plot it is clearly apparent that high precision and throughput at a low cost are
quite impossible.
__ Box 2.16
Relationships between precision and sensitivity
This box discusses a contradictory and a com plementary relationship between these two
analytical properties.
The Horwitz graph below is a paradigm of contradictory relationships between precision (as the coefficient of variation) and the increasing sensitivity required as the
analyte concentration decreases. In fact, at analyte concentrations above 0.1 %, CV = ± 5 %;
however, CV grows exponentially as the analyte concentration is decreased below that level.
This arises from the fact that variability sources become much more significant in trace
analysis.
The compl ementary relationship between precision and sensitivity materializes in the
variation of the uncertainty in a result with the slope (sensitivity) of the linear portion of the