

62
2 Analytical Properties
spectrophotometer to make an absorbance reading that was interpolated into a previously
run calibration curve to obtain the copper concentration, corrected for the volumes used in
the analytical process.
The precision of the method was assessed by determining the analyte six times (n = 6)
under five different types of experimental cond itions, namely:
(1) Using 1 L of sample, and preconcentrating and splitting the eluate into 6 aliquots that
were inserted into the instrument to obtain 6 data and 6 results.
(2) Using 6 aliquots of 1 L each, and preconcentrating and inserting each eluate into the
instrument, with the same equipment, reagents, ion exchanger, instrument, calibration
curve, etc., in the course of the same morning.
(3) Same as in (2). but with the processes conducted on different days.
(4) Same as in (3), but using different operators, reagents and AAS instrument.
(5) Six laboratories analysed 6 aliquots of 1 L of sample, using the same method.
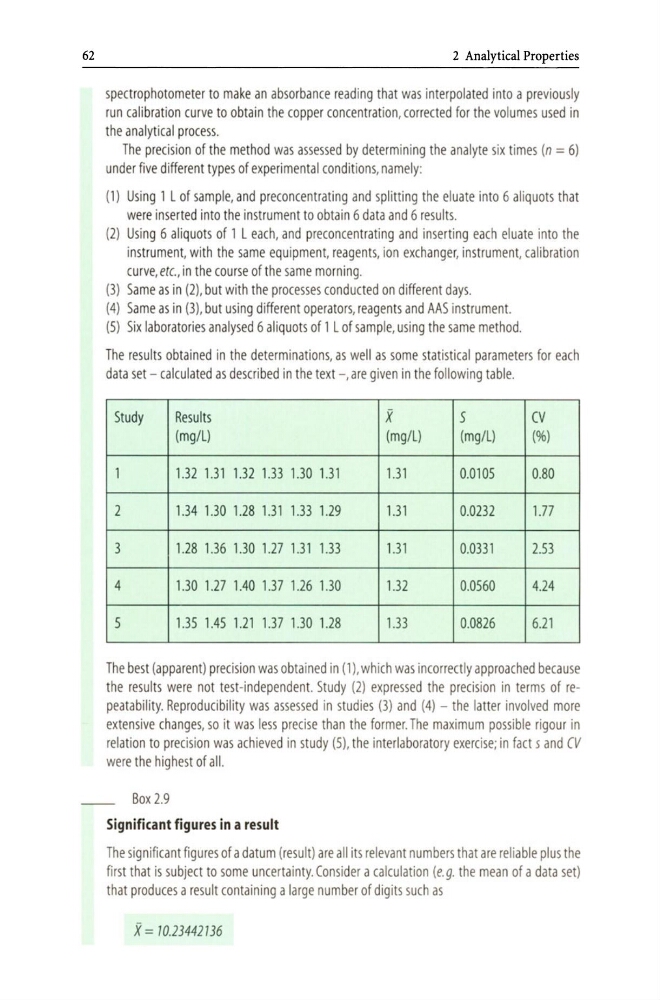
The results obtained in the determinations, as well as some statistical parameters for each
data set - calculated as described in the text - , are given in the following table.
Study
Results
X
5
CV
(mg/L)
(mg/L)
(mg/L)
(%)
1
1.32 1.31 1.32 1.33 1.30 1.31
1.31
0.0105
0.80
2
1.34 1.30 1.28 1.31 1.33 1.29
1.31
0.0232
1.77
3
1.28 1.36 1.30 1.27 1.31 1.33
1.31
0.0331
2.53
4
1.30 1.27 1.40 1.3 7 1.26 1.30
1.32
0.0560
4.24
5
1.35 1.45 1.21 1.37 1.30 1.28
1.33
0.0826
6.21
The best (apparent) precision was obtained in (1), which was incorrectly approached because
the results were not test-independent. Study (2) expressed the precision in terms of repeatability. Reproducibility was assessed in studies (3) and (4) - the latter involved more
extensive changes, so it was less precise than the forme r. The maximum possible rigour in
relation to precision was achieved in study (5). the interlaboratory exercise; in fact 5 and CV
were the highest of all.
__ Box 2.9
Significant figures in a result
The significant figures of a datum (result) are all its relevant numbers that are reliable plus the
first that is subject to some uncertainty. Consider a calculation (e.g. the mean of a data set)
that produces a result containing a large number of digits such as
X = 10.23442136
2 Analytical Properties
spectrophotometer to make an absorbance reading that was interpolated into a previously
run calibration curve to obtain the copper concentration, corrected for the volumes used in
the analytical process.
The precision of the method was assessed by determining the analyte six times (n = 6)
under five different types of experimental cond itions, namely:
(1) Using 1 L of sample, and preconcentrating and splitting the eluate into 6 aliquots that
were inserted into the instrument to obtain 6 data and 6 results.
(2) Using 6 aliquots of 1 L each, and preconcentrating and inserting each eluate into the
instrument, with the same equipment, reagents, ion exchanger, instrument, calibration
curve, etc., in the course of the same morning.
(3) Same as in (2). but with the processes conducted on different days.
(4) Same as in (3), but using different operators, reagents and AAS instrument.
(5) Six laboratories analysed 6 aliquots of 1 L of sample, using the same method.
The results obtained in the determinations, as well as some statistical parameters for each
data set - calculated as described in the text - , are given in the following table.
Study
Results
X
5
CV
(mg/L)
(mg/L)
(mg/L)
(%)
1
1.32 1.31 1.32 1.33 1.30 1.31
1.31
0.0105
0.80
2
1.34 1.30 1.28 1.31 1.33 1.29
1.31
0.0232
1.77
3
1.28 1.36 1.30 1.27 1.31 1.33
1.31
0.0331
2.53
4
1.30 1.27 1.40 1.3 7 1.26 1.30
1.32
0.0560
4.24
5
1.35 1.45 1.21 1.37 1.30 1.28
1.33
0.0826
6.21
The best (apparent) precision was obtained in (1), which was incorrectly approached because
the results were not test-independent. Study (2) expressed the precision in terms of repeatability. Reproducibility was assessed in studies (3) and (4) - the latter involved more
extensive changes, so it was less precise than the forme r. The maximum possible rigour in
relation to precision was achieved in study (5). the interlaboratory exercise; in fact 5 and CV
were the highest of all.
__ Box 2.9
Significant figures in a result
The significant figures of a datum (result) are all its relevant numbers that are reliable plus the
first that is subject to some uncertainty. Consider a calculation (e.g. the mean of a data set)
that produces a result containing a large number of digits such as
X = 10.23442136