

42
2 Analytical Properties
higher quality than the previous one, the theoretical upper quality limit for the
series being the mean for a statistical population (n = 00), which is denoted by p.
When n sample aliquots are analysed by different laboratories using various
analytical processes and a consensus is reached from a thorough technical study,
a result j(' is obtained that is held as true and represents referential quality in
Fig. 1.6; this kind of quality is typical of certified reference materials (CRMs),
which are discussed in Chap. 3. Total quality or theoretical ideal quality corresponds to the true value X associated to intrinsic information.
The former four landmarks (viz. Xi' X, p' and X') are obtained through
testing; by contrast, the latter two (p and X) are only ideal, theoretical data that
can never be obtained in practice.
As the chemical metrological hierarchy is climbed from Xi to X:
(a) Generic and specific uncertainty (Box 1.4) both decrease to 0, which corresponds to absolute trueness (X);
(b) closeness to the true value (accuracy), which is defined below, increases;
(c) representativeness in the information obtained increases with increasing
number of sample portions used from 1 to 00; and
(d) the number of data (results) that may accompany the result on each step of
the hierarchy decreases (thus, Xi may be accompanied by 00 results on the
first step while no datum other than X may exist on the last).
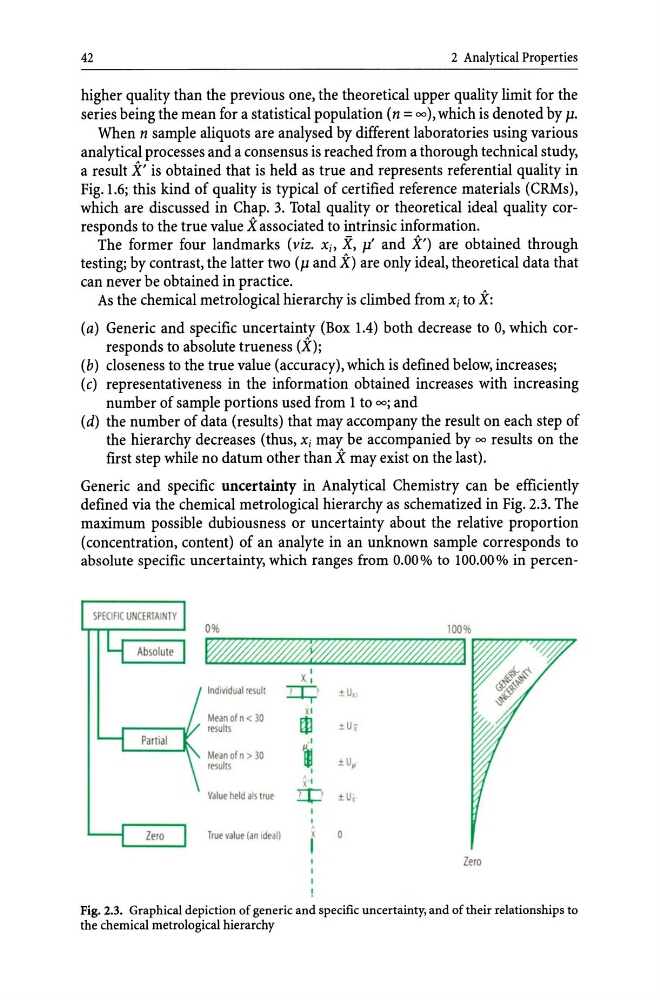
Generic and specific uncertainty in Analytical Chemistry can be efficiently
defined via the chemical metrological hierarchy as schematized in Fig. 2.3. The
maximum possible dubiousness or uncertainty about the relative proportion
(concentration, content) of an analyte in an unknown sample corresponds to
absolute specific uncertainty, which ranges from 0.00% to 100.00% in percenI
X.
Individual resull
:0:;' ±U.
Mean ofn < 30
XI
r~ulls
m ± U,
..
Mean of n > 30
~ _ U_
resulls
,
..
x"
Value held als !rue
2:{:' ±U,
,
True value Ian .deal)
X
I
Zero
Fig. 2.3. Graphical depiction of generic and specific uncertainty, and of their relationships to
the chemical metrological hierarchy
2 Analytical Properties
higher quality than the previous one, the theoretical upper quality limit for the
series being the mean for a statistical population (n = 00), which is denoted by p.
When n sample aliquots are analysed by different laboratories using various
analytical processes and a consensus is reached from a thorough technical study,
a result j(' is obtained that is held as true and represents referential quality in
Fig. 1.6; this kind of quality is typical of certified reference materials (CRMs),
which are discussed in Chap. 3. Total quality or theoretical ideal quality corresponds to the true value X associated to intrinsic information.
The former four landmarks (viz. Xi' X, p' and X') are obtained through
testing; by contrast, the latter two (p and X) are only ideal, theoretical data that
can never be obtained in practice.
As the chemical metrological hierarchy is climbed from Xi to X:
(a) Generic and specific uncertainty (Box 1.4) both decrease to 0, which corresponds to absolute trueness (X);
(b) closeness to the true value (accuracy), which is defined below, increases;
(c) representativeness in the information obtained increases with increasing
number of sample portions used from 1 to 00; and
(d) the number of data (results) that may accompany the result on each step of
the hierarchy decreases (thus, Xi may be accompanied by 00 results on the
first step while no datum other than X may exist on the last).
Generic and specific uncertainty in Analytical Chemistry can be efficiently
defined via the chemical metrological hierarchy as schematized in Fig. 2.3. The
maximum possible dubiousness or uncertainty about the relative proportion
(concentration, content) of an analyte in an unknown sample corresponds to
absolute specific uncertainty, which ranges from 0.00% to 100.00% in percenI
X.
Individual resull
:0:;' ±U.
Mean ofn < 30
XI
r~ulls
m ± U,
..
Mean of n > 30
~ _ U_
resulls
,
..
x"
Value held als !rue
2:{:' ±U,
,
True value Ian .deal)
X
I
Zero
Fig. 2.3. Graphical depiction of generic and specific uncertainty, and of their relationships to
the chemical metrological hierarchy