

5.6 Instrumental Qualitative Analysis
~
~
OJ
a.
E
~
?;".-;
c:
OJ
.~
E
~
::0
U
-1.1
-0.7
Cu
-OJ
+0,1
POlential (volts)
235
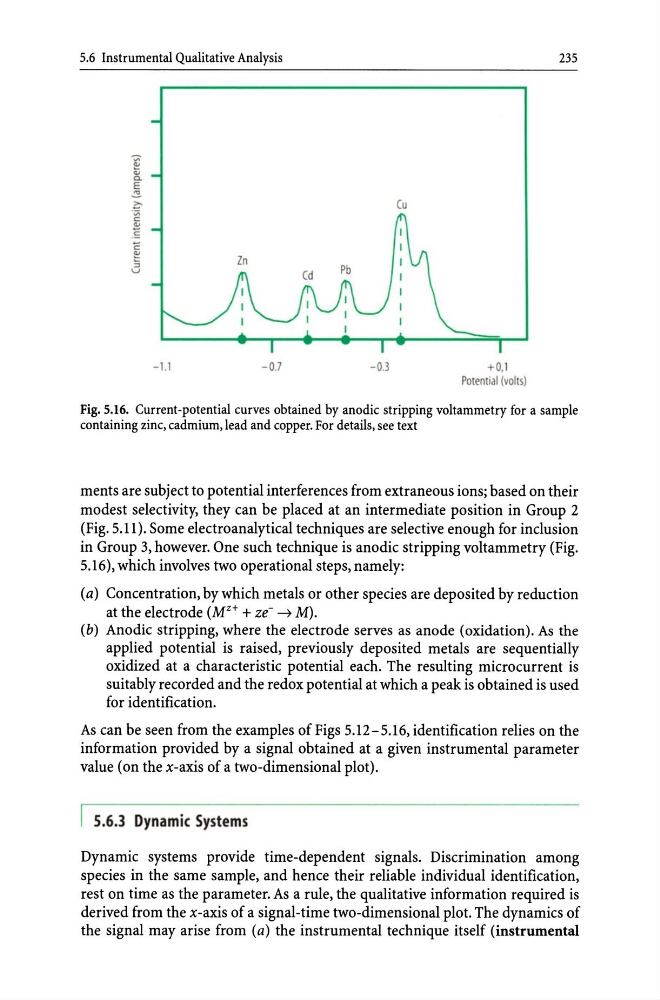
Fig. 5.16. Current-potential curves obtained by anodic stripping voltammetry for a sample
containing zinc, cadmium, lead and copper. For details, see text
ments are subject to potential interferences from extraneous ions; based on their
modest selectivity, they can be placed at an intermediate position in Group 2
(Fig. 5.11). Some electro analytical techniques are selective enough for inclusion
in Group 3, however. One such technique is anodic stripping voltammetry (Fig.
5.16), which involves two operational steps, namely:
(a) Concentration, by which metals or other species are deposited by reduction
at the electrode (M z+ + ze- - j M) .
(b) Anodic stripping, where the electrode serves as anode (oxidation). As the
applied potential is raised, previously deposited metals are sequentially
oxidized at a characteristic potential each. The resulting micro current is
suitably recorded and the redox potential at which a peak is obtained is used
for identification.
As can be seen from the examples of Figs 5.12-5.16, identification relies on the
information provided by a signal obtained at a given instrumental parameter
value (on the x-axis of a two-dimensional plot).
I 5.6.3 Dynamic Systems
Dynamic systems provide time-dependent signals. Discrimination among
species in the same sample, and hence their reliable individual identification,
rest on time as the parameter. As a rule, the qualitative information required is
derived from the x-axis of a signal-time two-dimensional plot. The dynamics of
the signal may arise from (a) the instrumental technique itself (instrumental
~
~
OJ
a.
E
~
?;".-;
c:
OJ
.~
E
~
::0
U
-1.1
-0.7
Cu
-OJ
+0,1
POlential (volts)
235
Fig. 5.16. Current-potential curves obtained by anodic stripping voltammetry for a sample
containing zinc, cadmium, lead and copper. For details, see text
ments are subject to potential interferences from extraneous ions; based on their
modest selectivity, they can be placed at an intermediate position in Group 2
(Fig. 5.11). Some electro analytical techniques are selective enough for inclusion
in Group 3, however. One such technique is anodic stripping voltammetry (Fig.
5.16), which involves two operational steps, namely:
(a) Concentration, by which metals or other species are deposited by reduction
at the electrode (M z+ + ze- - j M) .
(b) Anodic stripping, where the electrode serves as anode (oxidation). As the
applied potential is raised, previously deposited metals are sequentially
oxidized at a characteristic potential each. The resulting micro current is
suitably recorded and the redox potential at which a peak is obtained is used
for identification.
As can be seen from the examples of Figs 5.12-5.16, identification relies on the
information provided by a signal obtained at a given instrumental parameter
value (on the x-axis of a two-dimensional plot).
I 5.6.3 Dynamic Systems
Dynamic systems provide time-dependent signals. Discrimination among
species in the same sample, and hence their reliable individual identification,
rest on time as the parameter. As a rule, the qualitative information required is
derived from the x-axis of a signal-time two-dimensional plot. The dynamics of
the signal may arise from (a) the instrumental technique itself (instrumental