

5.6 Instrumental Qualitative Analysis
233
A""
I'
... B""
.~
,
.;;;
c:
...
. 5
\
~
\
c:
...
~
\
~
J
0
::>
\
u:
J
I
\
,
\
,
200
300
400
500
1
600
1
Wavelength
(nm)
A
B
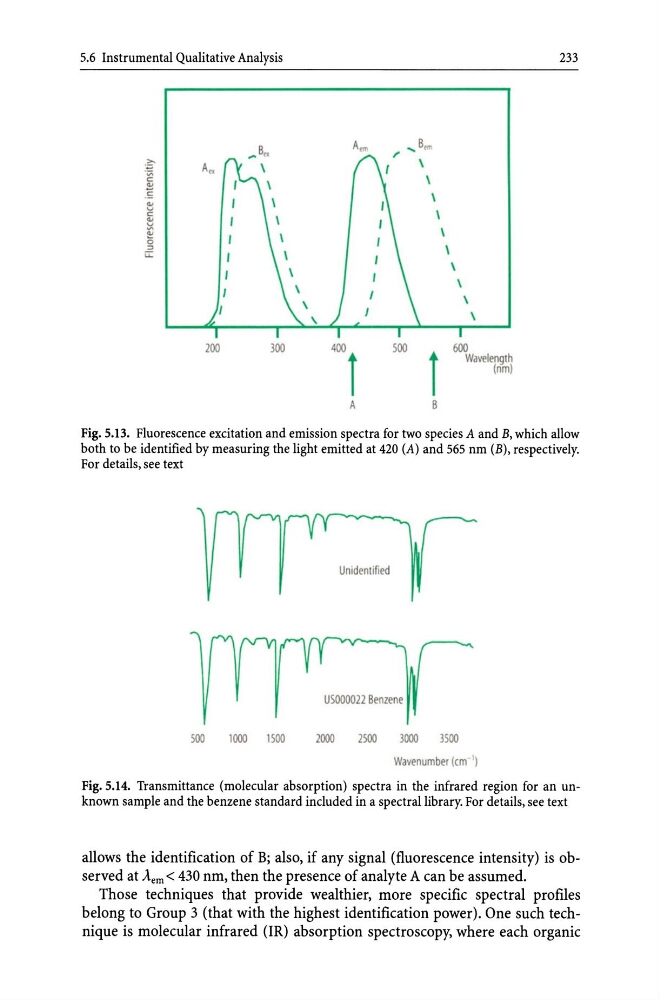
Fig. 5.13. Fluorescence excitation and emission spectra for two species A and B, which allow
both to be identified by measuring the light emitted at 420 (A) and 565 nm (B), respectively.
For details, see text
Unidentified
USoo0022 Benzene
500
1000
1500
2000
2500
3000
3500
Wavenumber (em ')
Fig. 5.14. Transmittance (molecular absorption) spectra in the infrared region for an unknown sample and the benzene standard included in a spectral library. For details, see text
allows the identification of B; also, if any signal (fluorescence intensity) is observed at Aern < 430 nm, then the presence of analyte A can be assumed.
Those techniques that provide wealthier, more specific spectral profiles
belong to Group 3 (that with the highest identification power). One such technique is molecular infrared (IR) absorption spectroscopy, where each organic
233
A""
I'
... B""
.~
,
.;;;
c:
...
. 5
\
~
\
c:
...
~
\
~
J
0
::>
\
u:
J
I
\
,
\
,
200
300
400
500
1
600
1
Wavelength
(nm)
A
B
Fig. 5.13. Fluorescence excitation and emission spectra for two species A and B, which allow
both to be identified by measuring the light emitted at 420 (A) and 565 nm (B), respectively.
For details, see text
Unidentified
USoo0022 Benzene
500
1000
1500
2000
2500
3000
3500
Wavenumber (em ')
Fig. 5.14. Transmittance (molecular absorption) spectra in the infrared region for an unknown sample and the benzene standard included in a spectral library. For details, see text
allows the identification of B; also, if any signal (fluorescence intensity) is observed at Aern < 430 nm, then the presence of analyte A can be assumed.
Those techniques that provide wealthier, more specific spectral profiles
belong to Group 3 (that with the highest identification power). One such technique is molecular infrared (IR) absorption spectroscopy, where each organic