

232
5 Qualitative Aspects of Analytical Chemistry
5.6.2 Static Systems
In static systems, the blank and standard are inserted into the instrument to
obtain a time-independent analytical signal. This information is usually twodimensional (a signal as a function of a single instrumental parameter) but can
occasionally be three-dimensional (a signal as a function of two instrumental
parameters), How reliable the identification is will depend directly on how well
the information profile of the analyte is resolved from those for other species in
the sample (i.e. on the group to which the instrumental technique belongs).
Figures 5.12-5.14 illustrate the use of optical molecular absorption techniques
with differential (increasing) identification power. UV-visible molecular
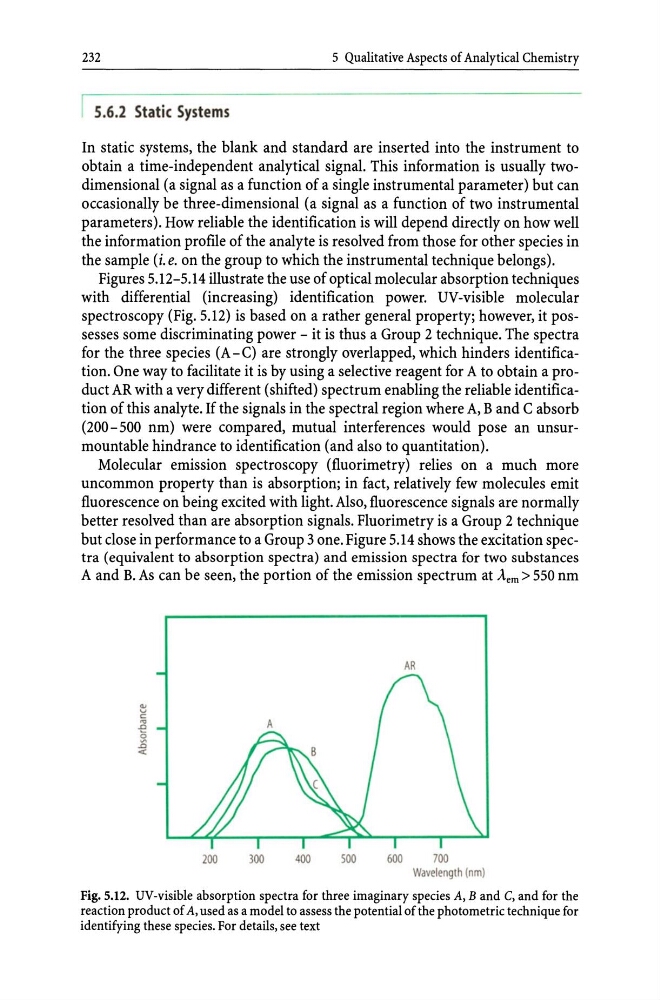
spectroscopy (Fig. 5.12) is based on a rather general property; however, it possesses some discriminating power - it is thus a Group 2 technique. The spectra
for the three species (A-C) are strongly overlapped, which hinders identification. One way to facilitate it is by using a selective reagent for A to obtain a product AR with a very different (shifted) spectrum enabling the reliable identification of this analyte. If the signals in the spectral region where A, Band C absorb
(200-500 nm) were compared, mutual interferences would pose an unsurmountable hindrance to identification (and also to quantitation).
Molecular emission spectroscopy (fluorimetry) relies on a much more
uncommon property than is absorption; in fact, relatively few molecules emit
fluorescence on being excited with light. Also, fluorescence signals are normally
better resolved than are absorption signals. Fluorimetry is a Group 2 technique
but close in performance to a Group 3 one. Figure 5.14 shows the excitation spectra (equivalent to absorption spectra) and emission spectra for two substances
A and B. As can be seen, the portion of the emission spectrum at Aern> 550 nm
AR
200
300
400
500
600
700
Wavelength (nm)
Fig. 5.12. UV-visible absorption spectra for three imaginary species A, Band C, and for the
reaction product of A, used as a model to assess the potential of the photometric technique for
identifying these species. For details, see text
5 Qualitative Aspects of Analytical Chemistry
5.6.2 Static Systems
In static systems, the blank and standard are inserted into the instrument to
obtain a time-independent analytical signal. This information is usually twodimensional (a signal as a function of a single instrumental parameter) but can
occasionally be three-dimensional (a signal as a function of two instrumental
parameters), How reliable the identification is will depend directly on how well
the information profile of the analyte is resolved from those for other species in
the sample (i.e. on the group to which the instrumental technique belongs).
Figures 5.12-5.14 illustrate the use of optical molecular absorption techniques
with differential (increasing) identification power. UV-visible molecular
spectroscopy (Fig. 5.12) is based on a rather general property; however, it possesses some discriminating power - it is thus a Group 2 technique. The spectra
for the three species (A-C) are strongly overlapped, which hinders identification. One way to facilitate it is by using a selective reagent for A to obtain a product AR with a very different (shifted) spectrum enabling the reliable identification of this analyte. If the signals in the spectral region where A, Band C absorb
(200-500 nm) were compared, mutual interferences would pose an unsurmountable hindrance to identification (and also to quantitation).
Molecular emission spectroscopy (fluorimetry) relies on a much more
uncommon property than is absorption; in fact, relatively few molecules emit
fluorescence on being excited with light. Also, fluorescence signals are normally
better resolved than are absorption signals. Fluorimetry is a Group 2 technique
but close in performance to a Group 3 one. Figure 5.14 shows the excitation spectra (equivalent to absorption spectra) and emission spectra for two substances
A and B. As can be seen, the portion of the emission spectrum at Aern> 550 nm
AR
200
300
400
500
600
700
Wavelength (nm)
Fig. 5.12. UV-visible absorption spectra for three imaginary species A, Band C, and for the
reaction product of A, used as a model to assess the potential of the photometric technique for
identifying these species. For details, see text