

5.2 The Binary Response
211
concentrations of Fig. 5.3. A false positive arises when the signal for a sample
containing the analyte at a level below the reference concentrations (false hypothesis) yields a YES response even though the sample is in fact a blank (i. e. it
results from acceptance as positive of samples that are not such but blanks). On
the other hand, a false negative results from the signal for a sample containing
the analyte at a level above the reference concentrations (true hypothesis) being
deemed a blank and a NO response thus being adopted; it is thus made in rejecting a signal for a sample containing the analyte in the mistaken belief that it
is a blank (i.e. that it does not contain the analyte).
The precise implications of these errors depend on the particular analytical
problem. As a rule, the results of screening tests and systems are confirmed by
using a conventional eMP when any errors made may have a significant social
or economic impact. False negatives are especially serious when detecting or
identifying a toxic chemical or chemical family as no confirmation analyses are
usually performed.
__ Box 5.6
The specific example of this box is intended to illustrate the concepts of reliability, false
positives and false negatives. It describes a CMP for screening benzodiazepines in human
urine with a limit of detection of 0.5 ~lM. The proponents of the method chose the blank
signal plus twice its standard deviation as the cut-off concentration. Such a concentration
was thus below the limit of detection (see its definition in Sect. 2.5.2). in contrast with the
situation of Fig. 5.3.
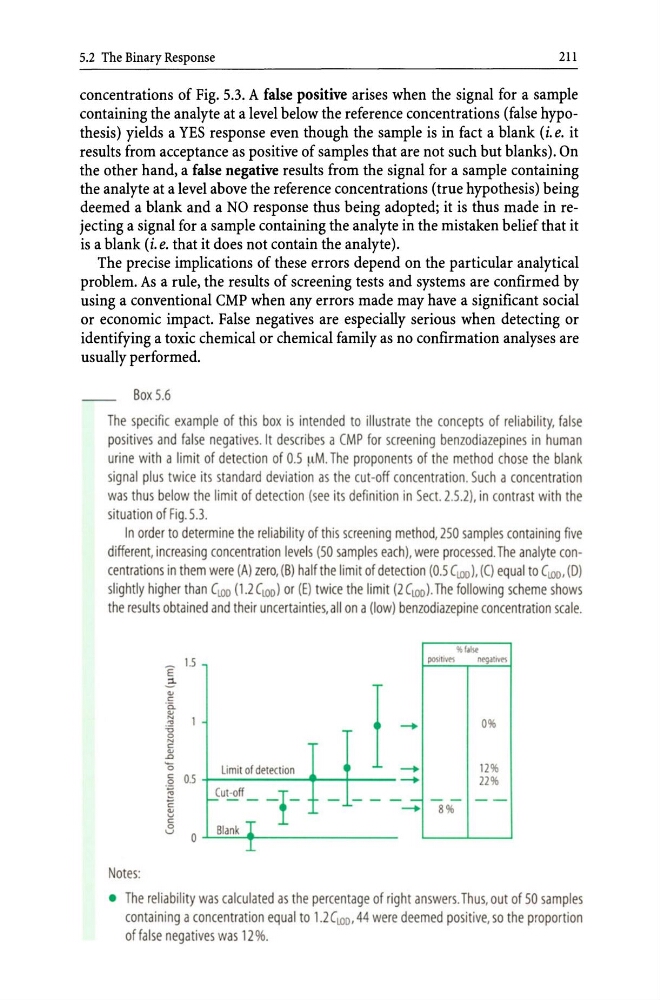
In order to determine the reliability of this screening method, 250 samples containing five
different, increasing concentration levels (50 samples each). were processed. The analyte concentrations in them were (A) zero, (B) half the limit of detection (0.5 ClOD ), (C) equal to ClOD, (D)
slightly higher than ClOD (1.2 CLOD ) or (E) twice the limit (2 ClOD)' The following scheme shows
the results obtained and their uncertainties, all on a (low) benzodiazepine concentration scale.
E
1.5
3'" c:
'0.
~
'"
:;:;
2
c:
'"
.0
'0
c: 0.5
.g
~
c
~
c:
0
u
0
Notes:
I
Limit of detection
-+
+---------~~--~---- -+
-
rS ut - off - -I- - - -
Blank I
-+
l
%'.1 ..
poll! .....
M'gi!lIVM
0%
12 %
22%
- - -8%
• The reliability was calculated as the percentage of rig ht answers. Thus, out of 50 samples
containing a concentration equal to 1.2 CLOD, 44 were deemed positive, so the proportion
of fa lse negatives was 12 %.
211
concentrations of Fig. 5.3. A false positive arises when the signal for a sample
containing the analyte at a level below the reference concentrations (false hypothesis) yields a YES response even though the sample is in fact a blank (i. e. it
results from acceptance as positive of samples that are not such but blanks). On
the other hand, a false negative results from the signal for a sample containing
the analyte at a level above the reference concentrations (true hypothesis) being
deemed a blank and a NO response thus being adopted; it is thus made in rejecting a signal for a sample containing the analyte in the mistaken belief that it
is a blank (i.e. that it does not contain the analyte).
The precise implications of these errors depend on the particular analytical
problem. As a rule, the results of screening tests and systems are confirmed by
using a conventional eMP when any errors made may have a significant social
or economic impact. False negatives are especially serious when detecting or
identifying a toxic chemical or chemical family as no confirmation analyses are
usually performed.
__ Box 5.6
The specific example of this box is intended to illustrate the concepts of reliability, false
positives and false negatives. It describes a CMP for screening benzodiazepines in human
urine with a limit of detection of 0.5 ~lM. The proponents of the method chose the blank
signal plus twice its standard deviation as the cut-off concentration. Such a concentration
was thus below the limit of detection (see its definition in Sect. 2.5.2). in contrast with the
situation of Fig. 5.3.
In order to determine the reliability of this screening method, 250 samples containing five
different, increasing concentration levels (50 samples each). were processed. The analyte concentrations in them were (A) zero, (B) half the limit of detection (0.5 ClOD ), (C) equal to ClOD, (D)
slightly higher than ClOD (1.2 CLOD ) or (E) twice the limit (2 ClOD)' The following scheme shows
the results obtained and their uncertainties, all on a (low) benzodiazepine concentration scale.
E
1.5
3'" c:
'0.
~
'"
:;:;
2
c:
'"
.0
'0
c: 0.5
.g
~
c
~
c:
0
u
0
Notes:
I
Limit of detection
-+
+---------~~--~---- -+
-
rS ut - off - -I- - - -
Blank I
-+
l
%'.1 ..
poll! .....
M'gi!lIVM
0%
12 %
22%
- - -8%
• The reliability was calculated as the percentage of rig ht answers. Thus, out of 50 samples
containing a concentration equal to 1.2 CLOD, 44 were deemed positive, so the proportion
of fa lse negatives was 12 %.