

CHAPTER 21 • (hemometries for Sampling and Analysis: Theory and Environmental Applications
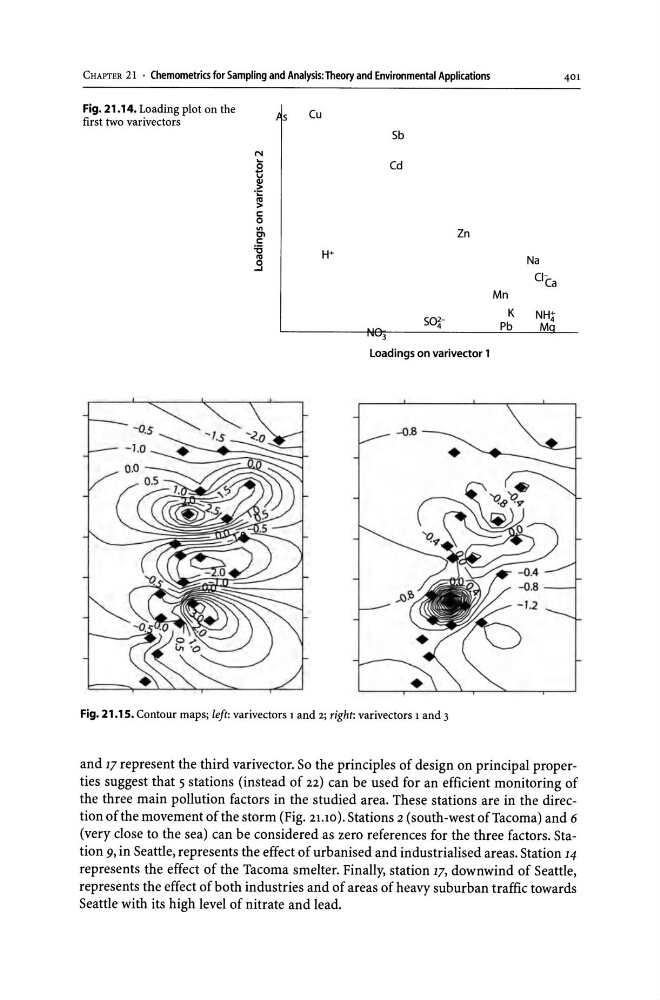
Fig. 21 .14. Loading plot on the
first two varivectors
Cu
Sb
Cd
Zn
S~Loadings on varivector 1
~.8
Fig. 21.15. Contour maps; left: varivectors 1 and 2; right: varivectors 1 and 3
401
Mn
K
NH;t
Pb
M
and 17 represent the third varivector. So the principles of design on principal properties suggest that 5 stations (instead of 22) can be used for an efficient monitoring of
the three main pollution factors in the studied area. These stations are in the direction of the movement of the storm (Fig. 21.10). Stations 2 (south-west of Tacoma) and 6
(very close to the sea) can be considered as zero references for the three factors. Station 9, in Seattle, represents the effect of urbanised and industrialised areas. Station 14
represents the effect of the Tacoma smelter. Finally, station 17, downwind of Seattle,
represents the effect of both industries and of areas of heavy suburban traffic towards
Seattle with its high level of nitrate and lead.
Fig. 21 .14. Loading plot on the
first two varivectors
Cu
Sb
Cd
Zn
S~Loadings on varivector 1
~.8
Fig. 21.15. Contour maps; left: varivectors 1 and 2; right: varivectors 1 and 3
401
Mn
K
NH;t
Pb
M
and 17 represent the third varivector. So the principles of design on principal properties suggest that 5 stations (instead of 22) can be used for an efficient monitoring of
the three main pollution factors in the studied area. These stations are in the direction of the movement of the storm (Fig. 21.10). Stations 2 (south-west of Tacoma) and 6
(very close to the sea) can be considered as zero references for the three factors. Station 9, in Seattle, represents the effect of urbanised and industrialised areas. Station 14
represents the effect of the Tacoma smelter. Finally, station 17, downwind of Seattle,
represents the effect of both industries and of areas of heavy suburban traffic towards
Seattle with its high level of nitrate and lead.