

400
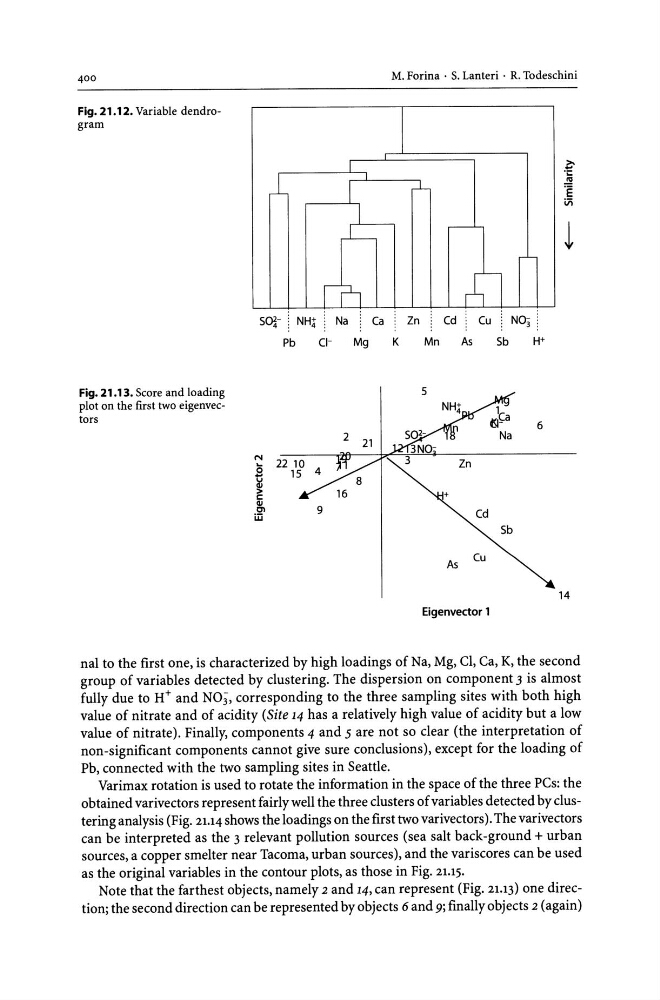
Fig. 21.12. Variable dendrogram
Fig. 21.13. Score and loading
plot on the first two eigenvectors
I
,L
I
1
.Lill
S~- : NH;( : Na
Ca
Pb
(1Mg
M. Forina . S. Lanteri . R. Todeschini
-L
r -
M
Zn
Cd: Cu ~ N03
Mn
As
Sb
H+
6
Sb
As
Cu
14
Eigenvector 1
nal to the first one, is characterized by high loadings of Na, Mg, CI, Ca, K, the second
group of variables detected by clustering. The dispersion on component 3 is almost
fully due to H+ and NO;, corresponding to the three sampling sites with both high
value of nitrate and of acidity (Site 14 has a relatively high value of acidity but a low
value of nitrate). Finally, components 4 and 5 are not so clear (the interpretation of
non-significant components cannot give sure conclusions), except for the loading of
Pb, connected with the two sampling sites in Seattle.
Varimax rotation is used to rotate the information in the space of the three PCs: the
obtained varivectors represent fairly well the three clusters of variables detected by clustering analysis (Fig. 21.14 shows the loadings on the first two varivectors). The varivectors
can be interpreted as the 3 relevant pollution sources (sea salt back-ground + urban
sources, a copper smelter near Tacoma, urban sources), and the variscores can be used
as the original variables in the contour plots, as those in Fig. 21.15.
Note that the farthest objects, namely 2 and 14, can represent (Fig. 21.13) one direction; the second direction can be represented by objects 6 and 9; finally objects 2 (again)
Fig. 21.12. Variable dendrogram
Fig. 21.13. Score and loading
plot on the first two eigenvectors
I
,L
I
1
.Lill
S~- : NH;( : Na
Ca
Pb
(1Mg
M. Forina . S. Lanteri . R. Todeschini
-L
r -
M
Zn
Cd: Cu ~ N03
Mn
As
Sb
H+
6
Sb
As
Cu
14
Eigenvector 1
nal to the first one, is characterized by high loadings of Na, Mg, CI, Ca, K, the second
group of variables detected by clustering. The dispersion on component 3 is almost
fully due to H+ and NO;, corresponding to the three sampling sites with both high
value of nitrate and of acidity (Site 14 has a relatively high value of acidity but a low
value of nitrate). Finally, components 4 and 5 are not so clear (the interpretation of
non-significant components cannot give sure conclusions), except for the loading of
Pb, connected with the two sampling sites in Seattle.
Varimax rotation is used to rotate the information in the space of the three PCs: the
obtained varivectors represent fairly well the three clusters of variables detected by clustering analysis (Fig. 21.14 shows the loadings on the first two varivectors). The varivectors
can be interpreted as the 3 relevant pollution sources (sea salt back-ground + urban
sources, a copper smelter near Tacoma, urban sources), and the variscores can be used
as the original variables in the contour plots, as those in Fig. 21.15.
Note that the farthest objects, namely 2 and 14, can represent (Fig. 21.13) one direction; the second direction can be represented by objects 6 and 9; finally objects 2 (again)